

-
1 Introduction
Compared to the 2014 elections, the 2019 elections saw a substantial shift in party preferences in all three regions. One of the most striking outcomes of the election was the rise of ‘extreme’ or ‘radical’ parties on both side of the left-right ideological spectrum. Decreasing levels of trust and rising dissatisfaction were quickly pointed out as the main determinants of these voting choices. The analysis provided by Govaerts et al. (2020) indicates that vote choices in 2019, and particularly votes for ‘populist’ parties (VB - Vlaams Belang, PTB-PVDA - Parti du Travail de Belgique- Partij van de Arbeid), were driven by protest attitudes, including political distrust, dissatisfaction with government and with the functioning of democracy, in addition to ideological motivations.
This article aims to dig deeper into the relationship between voters’ political resentment and their electoral choice in 2019 by focusing on the respondents’ emotions towards politics. To analyse the link between emotions and vote choice is quite innovative in Belgian political science, although it takes roots in a well-established field: that of political psychology. This article provides a very first exploration into the link between how voters feel towards politics and their vote choice, using the RepResent 2019 voter survey. Eight emotions are analysed: four negative (anger, bitterness, worry and fear) and four positive (hope, relief, joy and satisfaction).
The general question of the article is the following: do emotions towards politics matter? We answer that question in several steps. First, we look at the type and degree of emotions among respondents and how they relate to each other. We put to light different patterns of salience and distribution depending on the emotion considered. Interestingly, we confirm that voters’ emotional register is at least two-dimensional, with one positive and one negative dimension, opening the possibility for different combinations of emotions towards politics. Second, we analyse the relationship between emotions towards politics and vote choices in Wallonia and Flanders at the 2019 federal election (given the comparatively smaller sample and higher number of parties in Brussels, similar analyses respecting statistical thresholds could not be conducted in Brussels). We find different emotional patterns across party choices, and more crucially, we uncover a significant effect of emotions, especially negative ones, even when controlling for other determinants such as socio-demographics, political interest and political attitudes, including protest attitudes. Third, using the panel design of the survey, we investigate whether vote choices potentially affected respondents’ degree of positive and/or negative emotions after the election. We observe a potential winner vs. loser effect with distinctive dynamics in Flanders and in Wallonia. Overall, the emotional approach proposed in this article opens up innovative perspectives.
The article is structured as follows: It first briefly discusses the relevant literature. Second, it presents the data and variables used and provides general descriptive statistics. Third, it looks at emotions across vote choices through bivariate and multivariate models. Fourth, it analyses emotions between wave 1 (pre-electoral) and wave 2 (post-electoral), and the impact of vote choices on wave 1-wave 2 differentials. A final section concludes. -
2 Literature Review
The study of electoral behaviour has for long been at the core of political sociology. This has led to the development of classic explanatory models of vote choice: (1) the structural model considers long-term factors such as religion, socio-economic status and residency (Lazarsfeld et al., 1948) (2) the rational choice model (Downs, 1957) looks at voters’ evaluation of the performance of the incumbent government (see e.g. Lewis-Beck, 1986), the political offer (issue-voting, see e.g. Verba et al., 1976), or the choice of candidates and leaders (Bean & Mughan, 1989; Blais et al., 2003; Marsh, 2007), and (3) the socio-psychological model investigates party identification as cognitive and selective filters (Campbell et al., 1960). More recently attitudes towards democracy and political institutions were added as predictors, in line with the growing research on the crisis of representative democracy (Dalton, 2004; Norris, 1999, 2011).
Electoral studies in Belgium have frequently mobilised these classic approaches (Delruelle et al., 1970; Delwit & van Haute, 2008; Deschouwer et al., 2015; Frognier et al., 2007; Pilet et al., 2014). Nevertheless, they also contend that the explanatory power of most of these socio-structural determinants tends to decrease over time (Frognier et al., 2012). Scholars have also shown that dissatisfaction with government and distrust towards institutions explain refusal to participate (Henry et al., 2015; Hooghe et al., 2011) as well as extreme or protest voting (Billiet & Witte, 1995; Henry et al., 2015; Hooghe et al., 2011; Pauwels, 2010).
Following the general emotional turn in social and political sciences (Blondiaux &Traïni, 2018; Greco & Stenner, 2008; Faure & Négrier, 2017; Lemmings & Brooks, 2014; Thompson & Hogget, 2012), recent studies on protest vote have brought back psychological approaches to the study of voting behaviour (Rico et al., 2017; Vasilopoulos & Marcus, 2017; Vasilopoulos et al., 2019).These studies consider emotions as valuable and essential tools for rational thinking and decision-making (Marcus, 2002). One of the main debates in this burgeoning literature is whether emotions should be studied separately and multi-dimensionally, or as general dimensions opposing positive and negative emotions.
The tenants of the discrete approach (Marcus et al., 2000) argue that specific individual emotions have distinct, unique effects on voting behaviours, although the existing research is divided as to how many emotions should be tested. Studies range from five (Ekman, 1992) to seventeen or more (Roseman, 1996; Redlawsk & Pierce, 2017). Some emotions, such as enthusiasm, would mobilise voters to go out and vote. Other emotions, such as anxiety, lead voters to pay more attention to the campaign and get information. This approach has been widely applied to the study of protest voting. For instance, the analysis of emotions and extreme-right party support was motivated by the fact that the rhetoric of these parties precisely aims at activating people’s fear and anger towards various types of threat, from deep societal changes related to immigration or economic crisis, to security threats related to terrorism (Brader et al., 2008; Vasilopoulos et al., 2018). Hence, scholars have examined the role of anger and anxiety or fear in protest behaviour, and have brought new perspectives on the relationship between emotions and vote choices (Rico et al., 2017; Vasilopoulou and Wagner, 2017; Valentino et al., 2018; Vasilopoulos et al., 2019).
Several interesting findings emerged from their analyses. First, they acknowledge both theoretically and empirically that affective reactions can be multi-dimensional: individuals can experience several emotions (fear, anger or even enthusiasm) during a singular event or during a campaign, with various intensities (Marcus & Mackuen, 1993). Second, by measuring both anger and fear and testing their impact simultaneously, they have shown specific behavioural consequences for each. Fear would decrease support for the radical right, while anger would prompt it (Vasilopoulos et al., 2019). Vasilopoulos and Wagner (2018) find similar patterns in their study of Brexit: anger was positively associated with support for the Leave option; while fear prompted more moderate opinions. The explanatory mechanism would be that fear tends to inhibit reliance on established convictions such as party attachment and ideology (such as support for authoritarian policies), and would increase emphasis on evaluating arguments, candidates and policy issues (Valentino et al., 2008; Vasilopoulos & Marcus, 2017). By contrast, anger would tend to restrict from looking for counterarguments and would instead reinforce existing predispositions (Vasilopoulos, 2018; Vasilopoulos et al., 2019). In other words, “anger orients the brain toward existing habits of mind” (Valentino et al., 2018, p. 812), whereas fear or “anxiety will instead trigger risk-avoidance and new information seeking in the political realm” (Valentino et al., 2018, p. 812).
The main point of the tenants of the discrete approach is that research must investigate individual emotions separately. However, the discrete effect of individual emotions has come under much scrutiny (Redlawsk & Pierce, 2017). In the valenced view, the main point is to look at the dimensionality of emotions, and at general positive vs negative effects (Lodge & Taber, 2000). This approach has mainly been applied to the study of voters’ feelings and perceptions of individual candidates, and linked to the literature on personalisation.
Redlawsk and Pierce (2017) argue that both views are reconcilable, which is also the third approach by Lavine et al. (2012), who argue that voters can be ambivalent when partisanship conflicts with negative emotions generated by a candidate from a favoured party.
If the literature has investigated the effect of emotions on vote choice, studies have also looked at the reversed relationship. Studies have looked at the act of voting and its impact on citizens, their perceptions and emotions. Specifically, Anderson et al. (2005) have for instance looked at the effect of being on the winning or losing side of election results on legitimacy of institutions and the acceptation of the results (Stiers et al., 2018). While this is commonly done in majoritarian or bipartisan contexts, it is much more complex in a multilevel, multiparty system as Belgium.
This article contributes to this literature by providing a first insight into the relationship between emotions and vote choice in Belgium during the 2019 election. It departs from the above cited literature in at least four ways. First, the article does not focus specifically on support for radical right parties, but looks at the entire political spectrum (see for instance also Marcus, 1988) in Flanders and in Wallonia. Second, this article measures emotions towards Belgian politics, whereas existing studies use emotional reactions to the general state of the economy (Vasilopoulos & Marcus, 2017), to the economic crisis (Rico et al., 2017), or to specific threats such as terrorist attacks (Marcus et al., 2019; Vasilopoulos et al., 2018). Third, while recent studies have extensively examined the effect of anger and fear (or anxiety), this article includes a vast range of emotions, both positive and negative. Finally, we must acknowledge that the article does not aim to depict the psychological processes behind the relationship observed. We test the effect of emotions on vote choice, without looking at the antecedents of emotions. We investigate whether emotions do have a distinct relation with vote choice, even after controlling for other variables of interest such as satisfaction, trust and efficacy. Following the literature, we expect negative emotions to have a stronger effect on vote choice than positive emotions. We also expect negative emotions to have a larger effect on the choice of voting for protest parties. Lastly, we test whether vote choice potentially resulted in higher or lower negative and positive emotions among voters, thereby investigating the winner/loser effect in the Belgian context. -
3 Data1x To test our hypotheses, we rely on the RepResent panel survey. The survey is presented in length in the Introduction of this Special Issue. and Operationalisation
3.1 Measuring Emotions Towards Politics
One of the innovations of the RepResent project in the field of electoral sociology is to give greater consideration to the ‘affective’ dimension of the vote (see van Erkel & Turkenburg, 2020). One question asked respondents about the way they ‘feel’ about politics: ‘When you think about Belgian politics in general, how much do you feel the following emotions’. The questionnaire invited respondents to tell how much they feel each of the eight following emotions, on a scale from 0 (‘not at all’) to 10 (‘a great deal’): anger, bitterness, worry, fear, hope, relief, joy and satisfaction. These emotions were presented in a non-randomized order. The question was included in the pre- and post-electoral waves of the survey, allowing us to trace the evolution of respondents’ feelings before and after the election (see Section 4). Note that all analyses are computed with unweighted data; additional analyses computed with weighted data were done and did not show tremendous differences in the findings.2x Small differences in scores were for instance observed in bivariate analyses, i.e. scores obtained for small groups did vary slightly (e.g. ‘other party voters’ and ‘blank/null/abstention’ showing for instance less radical emotions when using weighted data).
Table 1 provides descriptive statistics for each emotion (wave 1) and Figure 1 uses boxplots. We can clearly see that four emotions present high average scores: anger, bitterness, worry, and fear – especially ‘worry’ which has the highest mean and highest median (see boxplot), and a mode at 7. Compared with other ‘negative’ emotions, fear shows a lower mean and median (horizontal line in Figure 1), and the highest variation (standard deviation of 2.8). By contrast, respondents seem to load relatively low on four additional emotions, especially on joy and relief, but also hope and satisfaction. These last four emotions have means below four on a 0-10 scale, while the means for the first four emotions range from 5.3 to 6.4. Half of the respondents are located between 0 (or 1) and 5 for relief, joy and satisfaction (see Figure 1). Around one respondent out of four indicates feeling no joy and no relief at all when thinking about Belgian politics. We can note that five constitutes the mode for many emotions. This can result from the absence of a ‘don’t know’ category in the proposed answers.Table 1 Emotions – descriptive statistics, wave 1 (N = 3,903)Mean Mode Std. deviation Anger 6.0 5 2.6 Bitterness 5.7 5 2.7 Worry 6.4 7 2.5 Fear 5.1 5 2.8 Hope 3.8 5 2.6 Relief 3.0 0 2.4 Joy 2.9 0 2.4 Satisfaction 3.5 5 2.5 Source: RepResent 2019 voter survey, wave 1.
Emotions – boxplots, wave 1 (N = 3,903)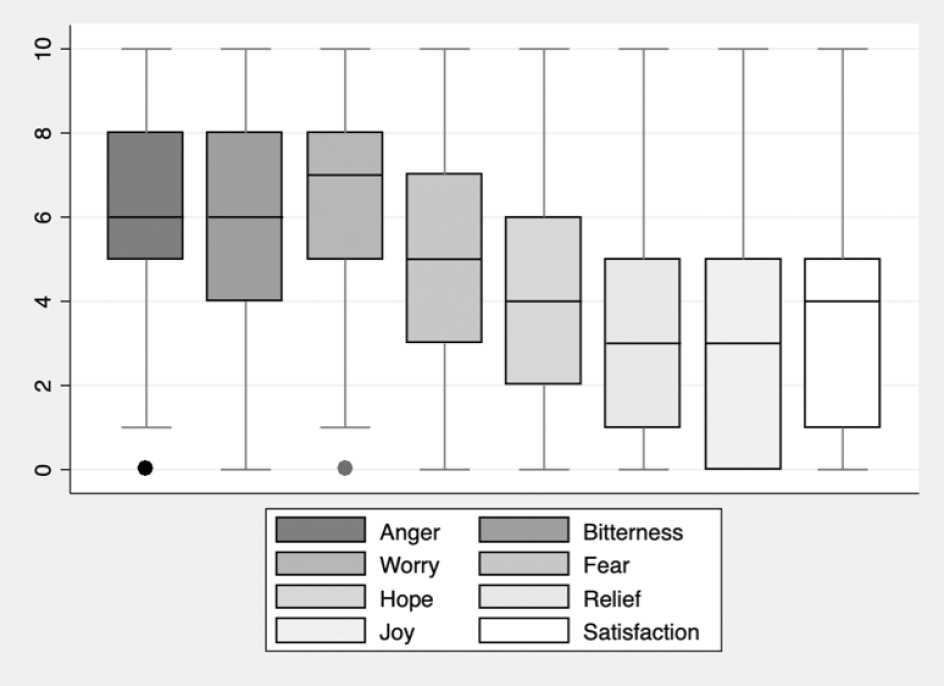 Source: RepResent 2019 voter survey, wave 1.
 3.2 Emotions Towards Politics: A Positive Dimension and a Negative Dimension
Table 2 investigates the degree to which these emotions correlate, that is, for instance, the extent to which respondents who are angry are also fearful at the same time. The table indicates that four ‘negative’ emotions ‘go (relatively) well together’: respondents who say they are angry, for instance, tend to report also high levels of fear, worry and bitterness. When comparing the values of the coefficients, we can see that four ‘positive’ emotions do correlate even more (coefficients between 0.6 and 0.7) than negative emotions (coefficients around 0.4 and 0.5).
What is even more interesting is the correlation between positive and negative emotions. We would logically expect that the more the respondent expresses negative emotions, the less s/he will express positive emotions. Such a relationship should translate in a negative and relatively high correlation coefficient. While Table 2 indeed displays negative coefficients between positive and negative emotions, these are relatively low (below 0.3). Especially, correlation between fear and positive emotions is very weak (below 0.1 in most cases).Hence, two dimensions emerge: a dimension related to negative emotions, and a dimension related to positive emotions.3x A principal component analysis reveals slightly more complex patterns. Before rotation, two components emerge. One seems to capture the ‘type’ of emotions expressed (eigen value at 3.6, 45% of explained variance), with positive emotions loading positively (factor loadings between 0.75 and 0.84) while negative emotions loading negatively (factor loadings between -0.40 and -0.60). The second component (eigen value at 2.4, 30% of explained variance) seems to capture the ‘intensity’ of the emotions expressed, with all emotions loading positively but factor loadings being higher for negative emotions (between 0.61 and 0.72) than for positive emotions (between 0.36 and 0.47). After rotation – whether promax, varimax or oblimin –, two clear components emerge: one component on which positive emotions highly and positively load (factors around 0.8-0.9) while negative emotions negatively and weakly load (factors around -0.1 - -0.2); the other one on which negative emotions positively and highly load, but on which positive emotions negatively and weakly load. Therefore, we compute two indexes by taking the mean of the sum of the respondents’ scores on positive or negative emotion. The positive emotion index scores between 0 and 10, with a mean at 3.3 (Cronbach’s alpha = 0.92, which indicates that the index is reliable given that the emotions correlate quite well); the negative emotion index scores between 0 and 10, with a mean at 5.8 (Cronbach’s alpha = 0.85). These two dimensions or indexes need to be considered separately as they do not correlate that much (Pearson’s correlation score = -0.239, at p<0.01 significance level). In other words, voters can display various combinations of emotions: some express high negative emotions and high positive emotions at the same time, while others show high negative emotions and low positive ones, display low negative and high positive or even low negative and low positive emotions. Based on the respondents’ scores on the two indexes, we observe that around 50% of them combine relatively high negative emotions (between 6 and 10) with relatively low positive emotions (between 0 and 5). About 30% combine low negative and low positive emotions, 12% combine high positive and high negative ones, and only 8% of the respondents combine high positive emotions with low negative ones.
The next two sections examine the relationship between emotions and the vote. In line with the other articles of the Special Issue, we limit the analysis to Flanders and Wallonia. Before detailing the dynamics observed within Flanders and Wallonia, we can nevertheless examine differences between the three regions (including thus Brussels) in terms of type and intensity of emotions (Table 3).
Voters in Flanders do feel lower negative emotions and higher positive emotions on average than voters in Wallonia and in Brussels. For positive emotions, the differences are significant4x Our comparisons of means throughout the article are based on Scheffé tests, as this test is quite conservative and is better suited for exploratory analyses (see Lee & Lee, 2018). We only consider significance levels below p < 0.05. between the three regions, but for negative emotions, differences are significant only between Wallonia and Flanders (no significant differences found between Flanders, with 5.6 on average, and Brussels with 5.8). If we detail emotion by emotion, differences are significant between the three regions for relief, joy and satisfaction, with voters in Flanders showing the highest scores, Walloon voters the lowest scores and voters in Brussels being in the middle. Walloon respondents show significant differences with voters in Flanders on all emotions. Significant differences between Brussels and Wallonia are found on fear and hope, and between Brussels and Flanders on bitterness.
These findings are in line with existing research using other indicators of resentment, such as political trust and satisfaction with government. These existing studies show that satisfaction and trust are consistently higher in Flanders than in Brussels and Wallonia, and higher in Brussels than in Wallonia (Close et al., 2020; Henry et al., 2015). Emotional indicators confirm this gap but reveal a more nuanced picture. We find few significant differences between Flanders and Brussels, or between Brussels and Wallonia on negative emotions. For instance, levels of anger and fear are very similar in Flanders and Brussels. Finally, in terms of intra-region variance, emotions vary slightly more in Brussels (standard error between 2.2 and 2.9) than in the two other regions, especially Flanders (between 2.1 and 2.7). If we compare means between communities instead of regions, Flemish and Francophone respondents show significant differences on all emotions (i.e. Francophones being less positive and more negative on average), the smallest difference being found for anger.Table 2 Emotions – correlation matrix (Kendall tau), wave 1 (N = 3,903)Anger Bitterness Worry Fear Hope Relief Joy Satisfaction Anger 1 0.57 -0.54 0.46 -0.21 -0.21 -0.24 -0.29 Bitterness 0.57 1 -0.49 0.44 -0.18 -0.17 -0.18 -0.24 Worry 0.54 0.49 1 0.52 -0.18 -0.22 -0.24 -0.26 Fear 0.46 0.44 -0.52 1 -0.07 -0.04 -0.04 -0.12 Hope -0.21 -0.18 -0.18 -0.07 1 0.59 0.60 0.63 Relief -0.21 -0.17 -0.22 -0.04 0.59 1 0.73 0.68 Joy -0.24 -0.18 -0.24 -0.04 0.60 0.73 1 0.71 Satisfaction -0.29 -0.24 -0.26 -0.12 0.63 0.68 0.71 1 Source: RepResent 2019 voter survey.
Note: All correlations are significant at p < 0.01 level.Table 3 Emotions in Brussels, Flanders and Wallonia – means, wave 1 (N = 3,903)Anger Bitterness Worry Fear Hope Relief Joy Satisfaction Index neg. Index pos. Brussels 5.9 5.8 6.4 5.0 3.8 3.0 2.9 3.4 5.8 3.3 Flanders 5.9 5.4 6.2 4.9 4.1 3.3 3.3 3.9 5.6 3.6 Wallonia 6.2 6.0 6.7 5.4 3.5 2.6 2.3 2.9 6.1 2.8 Mean 6.0 5.7 6.4 5.1 3.8 3.0 2.9 3.5 5.8 3.3 Source: RepResent 2019 voter survey, wave 1.
-
4 Emotions and Vote Choice
4.1 Bivariate Analyses
The tables and figures below compare emotions across party voters, in Flanders (Table 4 and Figure 2) and in Wallonia (Table 5 and Figure 3). We use respondents’ self-reported party choice at the federal level (in wave 2). The tables present, for each party or vote choice, the average score of voters on every emotion; the tables also include the average score on the negative and positive emotions indexes. These indexes are then used in the figures. The figures present graphically the position of each group of voters along two axes: the vertical axis accounts for their score on the negative emotions index, the horizontal axis accounts for their score on the positive emotions index.
In Flanders, CD&V (Christen-Democratisch en Vlaams) and OpenVLD (Open Vlaamse Liberalen en Democraten) voters appear to express the highest positive emotions (around 4.0-4.5), and the lowest negative ones (around 5.0). They are closely followed by N-VA (Nieuw-Vlaamse Alliantie) voters, then by Groen voters, with the latter showing slightly lower positive emotions – though the difference is barely significant. VB voters stand out as the category expressing the highest level of negative emotions, as a general mean and on each negative emotion separately (except for anger on which ‘other party’ voters score as high: 7.0). VB voters do feel significantly more angry and bitter than CD&V, OpenVLD, N-VA, Groen and sp.a (Socialistische Partij Anders) voters; they also express significantly more fear and worry than CD&V, OpenVLD, N-VA and Groen voters. Nevertheless, differences are not statistically significant when compared to other ‘protest’ voters (PVDA and other party voters) or to blank/null voters and abstainers. Besides, VB voters are not those showing the lowest level of positive emotions – these are found among ‘other party’ voters. However, this ‘other party’ category includes only 27 respondents, we must therefore take these scores with great care. In terms of level of positive emotions, VB and PVDA voters are very close.
Overall, in Flanders, two groups emerge: one is composed by CD&V, OpenVLD, N-VA and Groen voters. The second group gathers VB, PVDA and ‘other party’ voters. The level of emotional resentment of sp.a voters stands in between these two groups: they feel significantly less positive and more negative towards politics than CD&V, OpenVLD and N-VA voters; but they do feel significantly less negative than VB voters. Sp.a and Groen voters do differ in their level of negative emotions, sp.a voters being on average more negative by 0.8 point.Table 4 Emotions and vote choice – Flanders, comparison of means (N = 1,928)Anger Bitterness Worry Fear Hope Relief Joy Satisfaction Index neg. Index pos. CD&V 5.0 4.9 5.7 4.5 5.0 4.1 4.0 4.9 5.0 4.5 Groen 5.3 4.9 6.0 4.2 4.5 3.3 3.3 4.1 5.1 3.8 N-VA 5.4 4.9 5.9 4.5 4.7 3.7 3.7 4.6 5.2 4.2 OpenVLD 5.2 4.9 5.7 4.5 4.8 4.1 4.1 4.7 5.1 4.4 PVDA 6.8 5.9 6.8 5.1 3.5 2.4 2.3 2.9 6.1 2.8 sp.a 6.1 5.6 6.6 5.2 3.8 3.0 3.0 3.5 5.9 3.3 VB 7.0 6.6 7.0 5.9 3.2 2.6 2.6 2.9 6.6 2.8 Other party 7.0 6.2 6.4 5.6 2.6 2.4 2.3 2.4 6.3 2.4 Blank/null/abstention 6.3 5.8 6.3 5.4 3.4 3.0 2.8 2.7 6.0 3.0 Average 5.9 5.5 6.3 4.9 4.1 3.3 3.3 3.9 3.6 5.6 Source: RepResent 2019 voter survey.
Average positive and negative emotions per vote choice – Flanders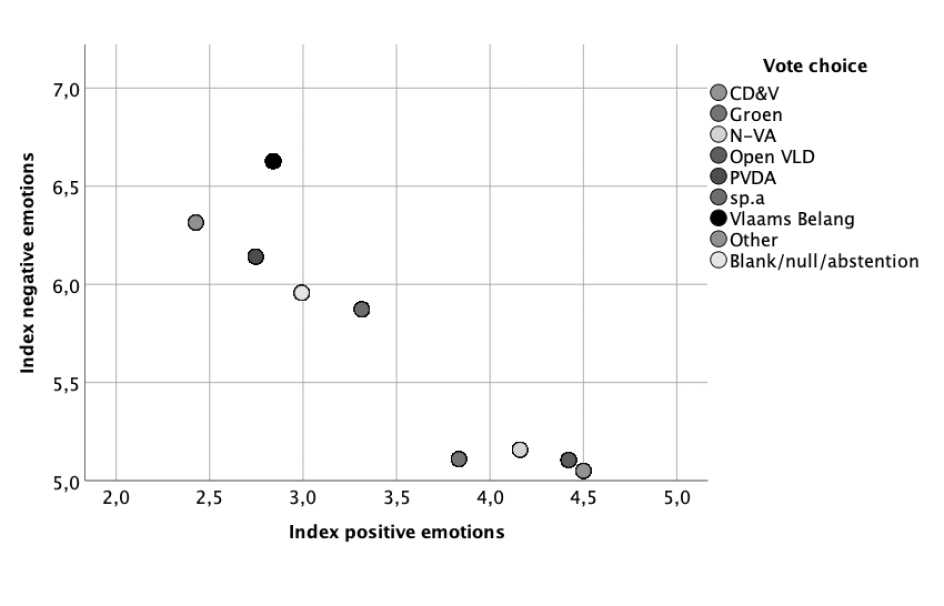 Source: RepResent 2019 voter survey.
 The situation is less clear-cut in Wallonia. On the lower right-hand side of the graph (Figure 2), MR (Mouvement réformateur) and cdH (Centre démocrate humaniste) voters appear as the least negative and the most positive. MR voters do feel significantly more positive than all other voters except cdH and PS (Parti Socialiste) voters; and they do feel significantly less negative than all other voters except those of the cdH. Hence, in terms of emotions, PS and MR voters do differ more in their level of negative emotions than in their level of positive ones. In the upper left-hand side of the graph, three groups are located very closely: PTB, PP (Parti Populaire) and other party voters. Their degree of negative emotions (and especially, of anger and worry) is significantly higher than that of cdh, MR, PS and Ecolo voters; and their degree of positive emotions is significantly lower than that of cdh, MR and PS voters. DéFI (Démocrate, Fédéraliste, Indépendant) stands out in the middle of the graph, quite close to Ecolo and the PS.
Table 5 Emotions and vote choice – Wallonia, comparison of means (N = 1,362)Anger Bitterness Worry Fear Hope Relief Joy Satisfaction Index neg. Index pos. cdH 5.4 5.5 6.0 4.7 4.1 3.1 3.2 3.8 5.4 3.6 DéFI 6.2 6.0 6.8 5.8 3.3 2.3 2.0 2.7 6.2 2.6 Ecolo 5.6 6.0 6.6 5.2 3.6 2.4 2.2 2.9 5.8 2.8 MR 5.1 5.1 5.9 4.7 4.4 3.4 3.1 4.1 5.2 3.8 PP 7.4 6.7 7.7 5.9 2.3 1.4 1.4 1.6 6.9 1.7 PS 6.1 5.8 6.7 5.4 3.9 2.9 2.7 3.1 6.0 3.1 PTB 7.5 7.1 7.7 6.3 2.4 1.7 1.7 1.4 7.1 1.8 Other party 7.4 7.2 7.4 6.1 2.3 1.6 1.5 1.9 7.0 1.8 Blank/null/Abstention 6.9 5.6 6.8 5.5 2.6 1.9 1.8 2.2 6.5 2.2 Average 6.2 5.8 6.6 5.4 3.5 2.6 2.4 2.9 6.1 2.8 Source: RepResent 2019 voter survey.
Average positive and negative emotions per vote choice – Wallonia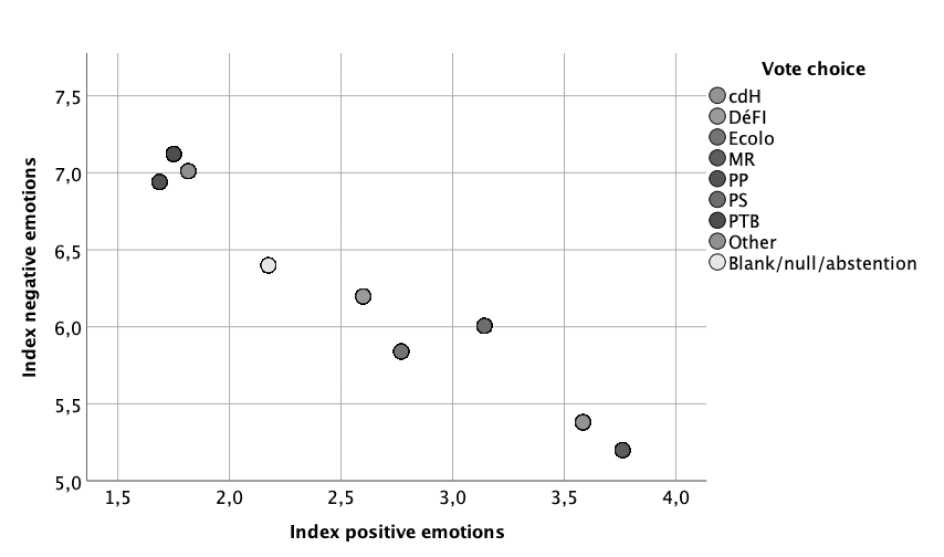 Source: RepResent 2019 voter survey.
 4.2 Multivariate Analysis
In order to confirm the usefulness of these emotional indicators of resentment, the tables below present multivariate models. These allow testing the impact of emotions while ‘controlling for’ other determinants of the vote, such as socio-demographic characteristics and political attitudes, as well as other indicators of resentment: satisfaction with government, political trust and external political efficacy. In doing so, the models allow us to evaluate how much emotions bring into the explanation of vote choice.
We include the following socio-demographic variables like age, gender and education. Then, we use three variables measuring respondents’ political preferences. The first one accounts for respondents’ self-placement on a left-right scale, from 0 (left) to 10 (right). The second one measures respondents’ ideological positioning on a major socio-economic issue:Some people think that the government should intervene as little as possible in the economy, others think that the government should intervene as much as possible in the economy. Can you place your opinion on a scale from 0 to 10, where 0 means that the government must intervene as little as possible and where 10 means that the government must intervene as much as possible?
We reverse the values, so that a higher score indicates a right-wing position. The third measure of political preferences uses respondents’ position on the immigration issue:
Some believe that non-western foreigners should be able to live in Europe while maintaining their own culture. Others believe that they must adapt to European culture. Where would you place yourself on a scale from 0 to 10, where 0 means that non-western foreigners must be able to fully retain their own culture and 10 that they must fully adapt to European culture?
A high score indicates a right-wing or ethnocentric position. The third type of control variables includes three traditional measures of resentment: satisfaction with government, trust and external political efficacy. Satisfaction with government is measured using the question “How satisfied are you with the content of the policies that have been implemented at the subsequent levels of government during the past years?” We use satisfaction with the federal government, as we try to explain voting choice at this level of power. The variable ranges from 0 ‘very dissatisfied’ to 10 ‘totally satisfied’. Then, we create an index for trust by adding respondents’ trust in political parties, federal parliament, politicians and the European Union and dividing it by four (Cronbach’s alpha = 0,93). We obtain an index ranging from 0 ‘no trust at all’ to 10 ‘complete trust’. Finally, we create an index of external political efficacy using respondents’ opinion (from 1 ‘totally disagree’ to 5 ‘totally agree’) over the following three items: (1) ‘In general, our political system works honestly’ (2) ‘Our political decision-making processes are sufficiently transparent’ (3) ‘In general, our political system works effectively’ (Cronbach’s alpha: 0.86).
In order to test the impact of emotions on vote choice, we faced two options. One option was to test the impact of all emotions simultaneously, in order to see if specific emotions increase the probability to vote for one or the other party. However, this scenario entailed potential problems of multicollinearity. In order to check for multicollinearity issues, we have used the VIF procedure and statistics. The VIF values reveal moderate scores (around 4-4.5) for relief, joy and satisfaction. As we have seen in the correlation table above (Table 2), these variables correlated above 0.68. Correlation analyses (not displayed) further reveal that these emotions correlate with satisfaction with the federal government (Pearsons’ coefficients >0.54) and even more with trust (Pearsons’ coefficients >0.65). These tests suggest that positive emotions (relief, joy and especially satisfaction) are quite redundant with attitudinal measurement of resentment. The other option – applied in the article – was to use the two indexes, positive and negative, as the main predictors of vote choice, as the VIF values indicate low multicollinearity problems. Tables 6 and 7 below use these two indexes but we provide additional tables (12 and 13) in the Appendix that keep disaggregated emotions in the list of predictors. We use both types of models to interpret the findings.
The tables present the results of multinomial regression models. This kind of model is probabilistic, meaning that it helps to evaluate the impact of predictors on the probability that a respondent would vote for one party instead of another (the reference category). For Flanders, the reference category is VB; for Wallonia, the reference category is PTB. The reported coefficients are the odds ratios. When the value of the coefficient is above one, the factor increases the probability to vote for one party instead of the VB or the PTB; when the value of the coefficient is below 1, the predictor decreases the probability to pick another party than VB or PTB. Note that because the number of respondents is limited in several categories of vote choice, we decided to group or delete certain categories of voters. In Flanders, we have omitted the ‘other party’ voter category, since it included less than 30 voters. In Wallonia, we grouped PP (N = 59 voters) and DéFi voters (N = 86) together with ‘other party’ voters (N = 46).
Overall, the findings in both regions suggest that negative emotions bring additional explanation: the effect of the negative emotions index remains significant even when we control for other determinants, including traditional indicators of resent.5x Note that when we exclude attitudinal variables from the models (satisfaction, trust and efficacy), the effect of the positive emotions index becomes significant (for CD&V, N-VA, OpenVLD, and sp.a in Flanders; and for cdH, MR and PS in Wallonia), and coefficients score around 1.2-1.3.The models presented in Appendix confirm that negative emotions impact more significantly vote choice than positive emotions, yet they also show that hope and satisfaction also affect vote choice. Looking at the adjusted McFadden pseudo R2 of the models allows to compare their explanatory power: for Flanders, they are very similar in both tables (0.195 in Table 6, 0.191 in Table 12), and the same is true for Wallonia (0.134 in Table 7, 0.131 in Table 13).
In Flanders, a high score on the negative emotion index decreases significantly the probability of voting for CD&V, N-VA, Groen and OpenVLD (0.01 significance level) rather than for VB. Looking at emotions separately, we see that anger significantly decreases the probability to vote for CD&V, fear decreases the probability to vote for Groen and PVDA, and bitterness decreases the probability to pick N-VA instead of VB. However, Groen voters worry more about Belgian politics, compared to VB voters. Interestingly, positive emotions are also at play. Hope significantly decreases the probability to vote for the VB instead of Groen. Satisfaction increases the probability to pick CD&V or N-VA instead of VB – the effect is similar to the one observed with satisfaction with the federal government.
Conclusions can also be drawn party by party. CD&V voters are less angry and more satisfied than VB voters; and they express more trust in political institutions. Groen voters express less fear but more worry and hope than VB voters. The profile of N-VA voters is quite similar to that of the CD&V, although they differ from VB by expressing less bitterness, while trust has no significant impact. OpenVLD voters appear less negative in general, and more trustful than VB voters. PVDA voters differ from VB in their lower level of fear, as well as in their higher trust (although this effect is not significant in Table 12). Sp.a voters do not differ much in terms of emotions from VB voters; they are nevertheless more trustful in political institutions.
Figures 4 graphically represents the impact of the negative emotion index on the probability of party choices in Flanders. We can see that the probability of VB voting is about 10% or less for respondents scoring very low on the index; and this probability reaches 30-35% when respondents express intense negative emotions – all other variables kept constant. By contrast, the probability to pick N-VA decreases significantly, from 40% when no negative emotion is expressed, to less than 20% when negative emotions are at their maximum.
In Wallonia, higher scores on the negative emotions index decrease the probability to vote for cdH, MR, PS and blank/null/abstention instead of PTB. Two negative emotions matter: PTB voters are significantly angrier than Ecolo voters and express significantly more bitterness than MR. Relief has an unexpected effect: feeling more relief decreases the probability to vote for the cdH, Ecolo, and other parties rather than for the PTB. By contrast to Flanders, fear and hope do not affect vote choice once control variables are taken into account. Satisfaction as an emotion plays an important role: dissatisfaction increases the probability to vote PTB rather than any other party except the PS, even if we control for satisfaction with government (which increases the probability to vote MR and Ecolo, compared to PTB).If we look party by party, cdH, Ecolo and MR voters differ from PTB voters in similar ways: they are older (except Ecolo voters in Table 7), more educated (especially Ecolo and MR), more right-wing (especially MR ones), and more satisfied with government policies (again, the effect is stronger for MR voters); and feel more satisfied when thinking about Belgian politics. PS, cdH and Ecolo voters also express more trust in institutions. Interestingly, there are very few differences between PTB and PS voters, except regarding age and political efficacy: PS voters are slightly older and perceive significantly more positively the functioning of the representative system.
When looking at the predicted probabilities on Figure 5, the effect of negative emotions on voting choice are less clear-cut than in Flanders. The probability of PTB voting is about 5% for respondents scoring very low on the index and reaches 17% when respondents express intense negative emotions – all other variables kept constant. By contrast, the probability of choosing MR or cdh is 10% point lower when the index is at its maximum (10), compared to an index of 0. Interestingly, the level of negative emotions expressed does not impact much the probability to vote for Ecolo and the PS, as the probability to opt for these two parties is quite constant across the values of the negative emotions index.Table 6 Explaining vote choice in Flanders – multinomial regression models (odds ratio)Ref. Category = VB CD&V Groen N-VA OpenVLD PVDA sp.a Blank/null/abs. Age 1.04*** 1.00 1.04*** 1.02* 1.01 1.03*** 1.03** Women 1.03 0.89 1.24 0.98 0.89 1.21 1.05 Education (ref.no/primary educ.) 1.00 1.00 1.00 1.00 1.00 1.00 1.00 Secondary school 1.43 3.93* 1.27 1.08 0.94 1.14 1.36 Higher non-university degree 3.91*** 12.34*** 2.23** 2.57** 2.09 1.43 1.65 University degree 5.55*** 25.15*** 3.32*** 2.79* 1.57 1.89 1.14 Left-Right self-placement 0.53*** 0.33*** 0.97 0.62*** 0.30*** 0.35*** 0.58*** Right socio-eco 0.93 0.88* 1.09* 1.03 0.93 0.94 1.06 Right immigration 0.93 0.87** 1.04 0.97 0.86** 0.98 1.00 Satisfaction with fed. gvt 1.25** 0.97 1.30*** 1.11 0.90 0.92 0.89 Trust index 1.23* 1.52*** 1.11 1.30** 1.21* 1.49*** 1.09 External pol. Efficacy 1.07 1.30 0.95 0.99 0.79 0.94 0.85 Index pos. emotions 1.09 0.91 1.08 1.09 0.99 0.92 1.11 Index neg. emotions 0.84** 0.84** 0.80*** 0.82*** 0.91 0.94 0.90 N 1,894 McFadden’s R2 0.221 Adj. McFadden’s R2 0.195 Source: RepResent 2019 voter survey.
Note: Exponentiated coefficients; ***p < 0.001, **p < 0.01, *p < 0.05.Negative emotions index and vote choice (Flanders) – predicted probabilities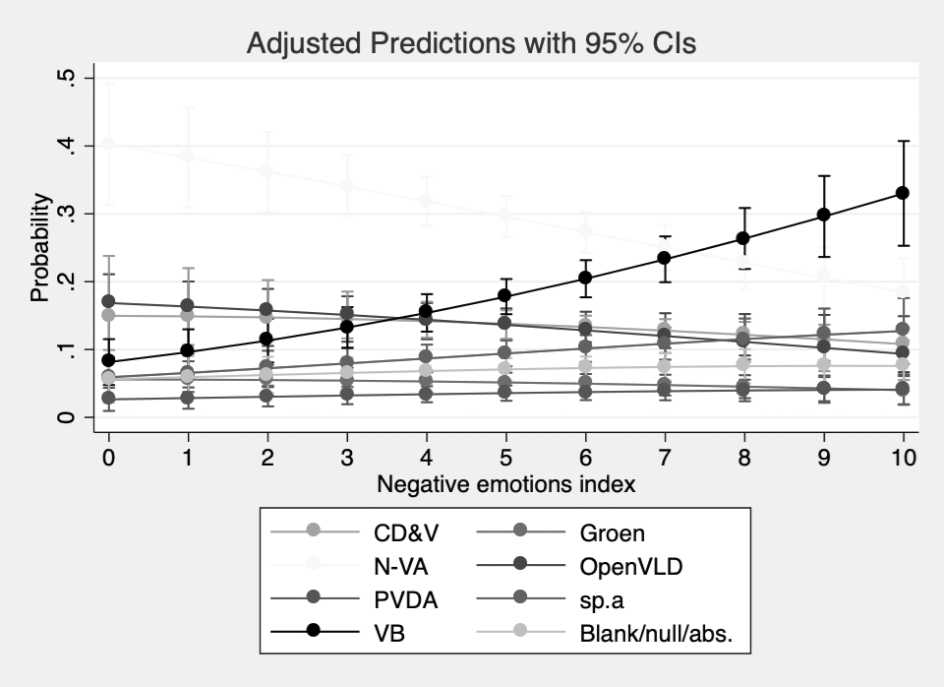 Source: RepResent 2019 voter survey.
Note: All other variables put at their means.Table 7 Explaining vote choice in Wallonia – multinomial regression models (odds ratio)Ref. category= PTB cdH Ecolo MR PS Other Blank/null/abs. Age 1.04*** 1.02 1.03** 1.02** 1.01 1.01 Women 1.10 1.01 1.26 1.08 1.12 1.07 Education (ref.no/primary educ.) 1.00 1.00 1.00 1.00 1.00 1.00 Secondary school 2.55 2.35* 2.33* 1.28 1.37 1.18 Higher non-university degree 4.22** 4.27*** 4.47*** 1.07 1.78 1.27 University degree 4.46** 6.95*** 6.73*** 1.53 2.78* 0.67 Left-right self-placement 1.34*** 1.12* 1.86*** 0.93 1.61*** 1.39*** Right socio-eco 1.03 1.06 1.08 1.00 1.06 1.01 Right immigration 0.97 1.03 1.11 1.06 1.14** 1.07 Satisfaction with fed. gvt 1.18 1.22** 1.69*** 1.04 1.08 1.02 Trust index 1.26* 1.28** 1.11 1.20* 1.12 0.99 External pol. Efficacy 1.21 1.31 1.38 1.69*** 1.18 1.28 Index pos. emotions 1.08 0.89 0.99 1.08 0.91 1.00 Index neg. emotions 0.81** 0.90 0.82** 0.90* 0.93 0.87* N 1,355 McFadden’s R2 0.167 Adj. McFadden’s R2 0.134 Source: RepResent 2019 voter survey.
Note: Exponentiated coefficients; ***p < 0.001, **p < 0.01, *p < 0.05.Negative emotions index and vote choice (Wallonia) – predicted probabilities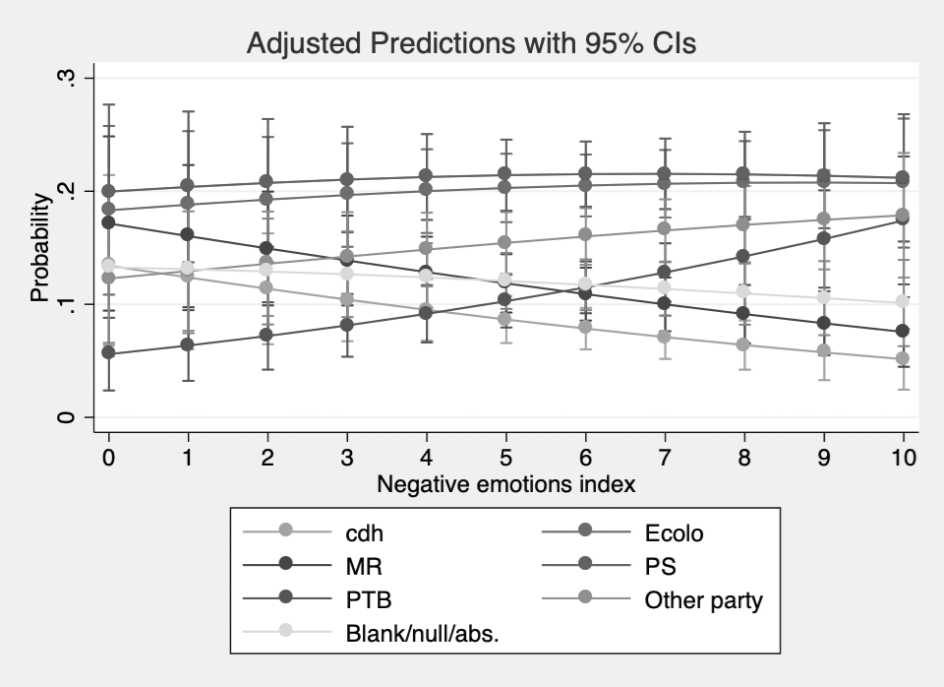 Source: RepResent 2019 voter survey.
Note: All other variables put at their means. -
5 Vote Choice and Emotions
In this final section, we briefly explore the evolution of emotions between wave 1 and wave 2, that is, before and after the 2019 election. We test whether vote choice potentially resulted in higher or lower negative and positive emotions. We expect that picking a winner party – defined as electoral winners, that is parties that increased their vote share (in absence of government formation, see Curini et al., 2012) – might increase the intensity of positive emotions and decrease the intensity of negative ones. In Flanders, VB voters should show the highest increase in positive emotions and the lowest increase in negative ones. In Wallonia, two winners can be identified, which have experienced the greatest increase in support: PTB, and Ecolo.
We calculate for each individual the difference in each emotion between wave 1 and wave 2, as well as the difference between their score on the indexes in wave 1 and wave 2. Tables 8 and 9 report, for each party voters, their average differentials on the positive and negative emotions indexes. Two tables in Appendix present party voters’ average differentials on each emotion separately (Tables 14 and 15). Tables 10 and 11 present simple linear regressions, where the dependent variables are the respondents’ differentials on the positive and negative emotions index, and the independent variables are the parties. These models test whether picking one party instead of the reference category (VB in Flanders, PTB in Wallonia) resulted in increasing or decreasing positive and negative emotions towards politics.In Flanders, a clear pattern emerges: VB voters are the only one expressing significantly more intense positive emotions after the election (Table 10). Their level of hope increases quite substantially (+0.41, see Appendix). This is interesting, as the analysis above revealed that lack of hope could differentiate VB voting from Groen voting. VB voters increase significantly their positive emotions: comparisons are statistically significant when compared to CD&V and OpenVLD for hope, joy and relief, and to CD&V for satisfaction. VB voters also stand out as the only group (with abstainers/blank/null voters) that does not feel more intense negative emotions after the election. Looking at emotions separately (see Appendix), differentials on negative emotions are not statistically significant (e.g. anger increases among most voters), except for fear. Groen voters appear as those facing the highest increase in fear (+0.87); whereas VB voters show a level of fear 0.33 point lower than before the election. The linear regression models presented in Table 10 confirm these trends. Voting for incumbent parties (CD&V, N-VA, OpenVLD), for Groen, and also blank/null voting and abstaining significantly decreases the level of positive emotions compared to voting for VB. Voting for any of the parties instead of VB also increases the level of negative emotions. Hence, the electoral success of this radical right party seems to have increased levels of negative feelings and decreased levels of positive feelings towards politics among other ‘loser’ voters.
Table 8 Differential Wave 2 – Wave 1 (Flanders). N = 1,972Positive emotions Negative emotions CD&V -0.57 +0.45 Groen -0.25 +0.41 N-VA -0.14 +0.22 OpenVLD -0.54 +0.33 PVDA +0.09 +0.02 sp.a +0.03 +0.25 VB +0.25 -0.08 Blank/null/abs. -0.38 -0.21 Average -0.14 +0.17 Sig. *** * Note: *** p<0.001, *p < 0.05
Source: RepResent 2019 voter survey.Table 9 Differential Wave 2 – Wave 1 (Wallonia), N = 1,473Positive emotions Negative emotions cdH +0.25 +0.48 Ecolo +0.13 +0.06 MR +0.03 +0.24 PS +0.51 +0.05 PTB +0.34 -0.02 Other +0.09 0.00 Blank/null/abs. -0.29 -0.06 Average +0.18 +0.09 Sig. ** - Note: **p < 0.01, - not significant.
Source: RepResent 2019 voter survey.Again, dynamics differ in Wallonia. Contrary to what happened in Flanders, the average level of positive emotions has increased after the election; it has increased more than the average level of negative emotions. Besides, the average level of negative emotions has increased less in Wallonia than in Flanders. Most party voters increase their level of positive emotions, and especially, PS and PTB voters. If we look at each emotion independently (see Table 15 in Appendix), we see that PS voters express significantly higher levels of hope, relief and satisfaction after the election. PS voters show increases in hope and satisfaction similar to and even higher than PTB voters. In terms of negative emotions, cdH and MR voters increase their average level of negative emotions after the election, especially cdH voters (Table 10) – which is coherent with the historically low score of the cdH.
In Table 12, we see that few relationships emerge at the 0.05 significance level. Compared to PTB voters, voters opting for MR, blank/null voting or abstaining, experience a higher decrease in positive emotions after the election. Compared to PTB voters, cdH voters significantly show a higher increase in negative emotions after the election. Again, voters opting for one or the other member of the former (regional) government experience either a greater increase in negative emotions either a decrease in positive ones. However, whereas we expected PTB and Ecolo voters to experience both an increase in positive and a decrease in negative emotions (since they could be considered as the two winners of the election), we find ‘winner’ patterns among PS and PTB voters. This may reflect that these voters were satisfied and even happy to see a left-wing ‘wave’ in Wallonia (PTB, Ecolo and PS won together a majority of seats in the regional parliament), or this may result from the capacity of the PS to appear as a winner, despite a historically low score.Table 10 Vote choice and changes in emotions – linear regression models (Flanders)Positive emotions Negative emotions Ref. category: VB CD&V -0.82*** 0.53** Groen -0.50** 0.48* N-VA -0.39*** 0.30* OpenVLD -0.79*** 0.41* PVDA -0.16 0.10 sp.a -0.22 0.33 Blank/null/abs. -0.63** -0.14 Constant 0.25** 0.00 N 1,898 1,898 R2 0.024 0.008 Adjusted R2 0.021 0.005 Source: RepResent 2019 voter survey.
Note: ***p < 0.001, **p < 0.01, *p < 0.05.Table 11 Vote choice and changes in emotions – linear regression models (Wallonia)Ref. category: PTB Positive emotions Negative emotions cdH -0.09 0.50 Ecolo -0.21 0.08 MR -0.31 0.26 PS 0.17 0.07 Other -0.25 0.02 Blank/null/abs. -0.63* -0.03 Constant 0.34** -0.02 N 1,357 1,357 0.014 0.004 Adjusted R2 0.010 -0.000 Source: RepResent 2019 voter survey.
Note: *p < 0.01, **p < 0.05 -
6 Conclusion
This article constitutes one of the first attempts to analyse the role of emotions towards politics on electoral choices in Belgium. At the empirical level, the main contribution of this article has been to look at the role of emotions towards politics in general, whereas existing studies examine emotions towards the general state of the economy, or specific contextual events. Our analyses have allowed assessing the potential explanatory power of emotional measures of democratic resentment.
Second, the article innovates as it has looked beyond the role of negative emotions and addressed the role as well of (a lack of) positive ones. It has therefore considered the emotional repertoire to be at least two-dimensional. Using both types of emotions has allowed highlighting more fine-grained dynamics within the two regions and across parties.
Third, while recent studies have especially focused on the impact of (negative) emotions on extreme right-wing voting, this article has also considered radical left as well as mainstream parties as potential receptacles of negative emotions or (lack of) positive ones. The article has looked in detail at the degree of each emotion for voters of all major parties of Flanders and Wallonia. Findings confirm previous studies that suggest that negative feelings, especially anger and fear, constitute major drivers of support for extreme-right parties (in our case, the VB). But they also show that lack of hope may be important as well. In addition, we uncovered that negative emotions and lack of positive ones can also prompt support for radical left parties – although to a lesser extent.
Fourth, the panel survey design has allowed looking at emotions in a longitudinal way. By analysing the impact of vote choice on the evolution of emotions between the pre and post-electoral period, we have again uncovered different dynamics in Flanders and Wallonia. The results of the election in Flanders have made VB voters more positive and less negative, whereas the political outcome of the election has increased fear and decreased positive feelings among traditional ‘pillar’ party voters and Groen voters. Hence, the electoral success of this radical right party may not only have affected emotions of its voters, but potentially impacted on other party voters’ feelings – although we did not directly test whether emotions changed as a result of voters’ perception of their own party or other parties winning or losing. In Wallonia, the left-wing majority that came out of the election in the regional parliament has increased satisfaction and hope among voters of two left-wing parties: PTB and PS – although the Socialist Party has endured a historical setback in 2019.
Overall, our findings suggest that emotions towards politics can be considered as independent and specific dimensions of resent. Although they contribute quite modestly in terms of explanatory power, their impact on vote choice is significant, and they vary through time depending on the outcome of the election. We argue that emotions towards politics should more systematically be included in opinion polls and electoral studies, as they have the potential to grasp more volatile and context-driven feelings towards politics, compared to traditional and more deeply rooted attitudes.
One way to do so is by joining force with qualitative research scholars. Qualitative research can inform us on voter perceptions and their sources. Qualitative interviews and focus groups can inform us on the sources of these perceptions, be it the media and the electoral campaign, other institutionalised organisations, etc. The results of the qualitative work can then be taken into account in the formulation of questions in large-scale voter surveys, and in the inclusion of more fine-grained and specific emotional registers. References Anderson, C. J., Blais, A., Bowler, S., Donovan, T. & Listhaug, O. (2005). Losers’ consent: Elections and Democratic legitimacy. Oxford University Press.
Bean, C. & Mughan, A. (1989). Leadership effects in parliamentary elections in Australia and Britain. American Political Science Review, 83, 1165-1179.
Billiet, J. & Witte, H. D. (1995). Attitudinal dispositions to vote for a ‘new’ extreme right-wing party: The case of ‘Vlaams Blok’. European Journal of Political Research, 27, 181-202.
Blais, A., Gidengil, E., Dobrzynska, A., Nevitte, N. & Adeau, R. (2003). Does the local candidate matter? Candidate effects in the Canadian Election of 2000. Canadian Journal of Political Science, 36, 657-664.
Blondiaux, L. & Traïni, C. (Eds.). (2018). La démocratie des émotions. Presses de SciencesPo.
Brader, T., Valentino, N. A. & Suhay, E. (2008). What triggers public opposition to immigration? Anxiety, group cues, and immigration threat. American Journal of Political Science, 52, 959-978.
Campbell, A., Converse, P. E., Miller, W. E. & Stokes, D. E. (1960). The American voter. Wiley.
Close, C., Dodeigne, J., Hennau, S. & Reuchamps, M. (2020). In R. Dandoy, J. Dodeigne, K. Steyvers & T. Verthé (Eds.), Les Électeurs Locaux Ont Leurs Préférences. Une Analyse Des Élections Communales de 2018. Vanden Broele (forthcoming).
Curini, L., Jou, W. & Memoli, V. (2012). Satisfaction with democracy and the winner/loser debate: The role of policy preferences and past experience. British Journal of Political Science, 42(2), 241-261.
Dalton, R. J. (2004). Democratic challenges, democratic choices: The erosion of political support in advanced industrial democracies. Oxford University Press.
Delruelle, N., Evalenko, R. & Frayes, W. (1970). Le comportement politique des électeurs belges: enquête de sociologie électorale: la rupture de 1965, ses prolongements en 1968. Editions de l’Institut de sociologie.
Delwit, P. & van Haute, E. (Eds.). (2008). Le vote des Belges (Bruxelles – Wallonie, 10 juin 2007). Université de Bruxelles.
Deschouwer, K., Delwit, P., Hooghe, M., Baudewyns, P. & Walgrave, S. (Eds.). (2015). Décrypter l’électeur. Le comportement électoral et les motivations de vote. Lannoo.
Downs, A. (1957). An economic theory of democracy. Harper.
Ekman, P. (1992). An argument for basic emotions. Cognition and Emotion, 6(3-4), 169-200.
Faure, A. & Négrier, E. (2017). La politique à l’épreuve des émotions. Presses Universitaires de Rennes.
Frognier, A.-P., Bol, D. & Swyngedouw, M. (2012). Une démocratie multipartisane. Flandre – Wallonie: 20 ans d’analyse des comportements électoraux. In A. Von Busekist (Ed.), Singulière Belgique (pp. 135-145). Fayard.
Frognier, A.-P., De Winter, L. & Baudewyns, P. (Eds.). (2007). Elections: le reflux?: Comportements et attitudes lors des élections en Belgique. De Boeck.
Govaerts, I., Kern, A., van Haute, E., Marien S. (2020). Drivers of Support for the Populist Radical Left and Populist Radical Right in Belgium: An Analysis of the VB and the PVDA-PTB Vote at the 2019 Elections. Politics of the Low Countries, Vol.X(3), pp. XXX
Greco, M. & Stenner, P. (Eds.). (2008). Emotions. A social science reader. Routledge.
Henry, L., Van Haute, E. & Hooghe, M. (2015). Confiance, satisfaction et comportement électoral dans un Etat fédéral. In K. Deschouwer, P. Delwit, M. Hooghe, P. Baudewyns & S. Walgrave (Eds.), Décrypter l’électeur. Le Comportement Électoral et Les Motivations de Vote (pp. 213-234). Tielt.
Hooghe, M., Marien, S. & Pauwels, T. (2011). Where do distrusting voters turn if there is no viable exit or voice option? The impact of political trust on electoral behaviour in the Belgian Regional Elections of June 2009. Government & Opposition, 46, 245-273.
Lavine, H. G., Johnston, C. D. & Steenbergen, M. R. (2012). The ambivalent partisan: How critical loyalty promotes democracy. Oxford University Press.
Lazarsfeld, P. F., Berelson, B. R. & Gaudet, H. (1948). The people’s choice. How the voter makes up his mind in a presidential campaign. Columbia University Press.
Lee, S. & Lee, D. K. (2018). What is the proper way to apply the multiple comparison test? Korean Journal of Anesthesiology, 71(5), 353-360.
Lemmings, D. & Brooks, D. (2014). The emotional turn in the humanities and social sciences. In D. Lemmings & D. Brooks (Eds.), Emotions and social change: Historical and sociological perspectives (pp. 3-18). Routledge.
Lewis-Beck, M. S. (1986). Comparative economic voting: Britain, France, Germany, Italy. American Journal of Political Science, 30, 315-346.
Lodge, M. & Taber, C. S. (2000). Three steps toward a theory of motivated political reasoning. In A. Lupia, M. D. McCubbins & S. L. Popkin (Eds.), Elements of reason: cognition, choice, and the bounds of rationality (pp. 183-213). Cambridge University Press.
Marcus, G. E. (1988). The structure of emotional response: 1984 presidential candidates. American Political Science Review, 82, 737-761.
Marcus, G. E. (2002). The sentimental citizen: Emotion in democratic politics. Pennsylvania State University Press.
Marcus, G. E. & Mackuen, M. B. (1993). Anxiety, enthusiasm, and the vote: The emotional underpinnings of learning and involvement during presidential campaigns. American Political Science Review, 87, 672-685.
Marcus, G. E., Neuman, W. R. & MacKuen, M. (2000). Affective intelligence and political judgement. University of Chicago Press.
Marcus, G. E., Valentino, N. A., Vasilopoulos, P. & Foucault, M. (2019). Applying the theory of affective intelligence to support for authoritarian policies and parties. Political Psychology, 40, 109-139.
Marsh, M. (2007). Candidates or parties? Objects of electoral choice in Ireland. Party Politics, 13, 500-527.
Norris, P. (Ed.). (1999). Critical citizens: Global support for democratic governance. Oxford University Press.
Norris, P. (2011). Democratic deficit: Critical citizens revisited. Cambridge University Press.
Pauwels, T. (2010). Explaining the success of Neo-Liberal Populist Parties: The case of Lijst Dedecker in Belgium. Political Studies, 58(5), 1009-1029.
Pilet, J.-B., Dassonneville, R., Hooghe, M. & Marien, S. (Eds.). (2014). L’électeur local: Le comportement électoral au scrutin communal de 2012. Éditions de l’université de Bruxelles.
Redlawsk, D. P. & Pierce, D. R. (2017). Emotions and voting. In K. Arzheimer, J. Evans & M. S. Lewis-Beck (Eds.), The SAGE handbook on electoral behaviour. Routledge.
Rico, G., Guinjoan, M. & Anduiza, E. (2017). The emotional underpinnings of populism: How anger and fear affect populist attitudes. Swiss Political Science Review, 23, 444-461.
Roseman, I. J. (1996). Appraisal determinants of emotions: Constructing a more accurate and comprehensive theory. Cognition and Emotion, 10(3), 241-278.
Stiers, D., Daoust, J.-F. & Blais, A. (2018). What makes people believe that their party won the election? Electoral Studies, 55, 21-29.
Thompson, S. & Hogget, P. (Eds.). (2012). Politics and the emotions. The affective turn in contemporary political studies. Continuum International Publishing Group.
Valentino, N. A., Hutchings, V. L., Banks, A. J. & Davis, A. K. (2008). Is a worried citizen a good citizen? Emotions, political information seeking, and learning via the internet. Political Psychology, 29, 247-273.
Valentino, N. A., Wayne, C. & Oceno, M. (2018). Mobilizing sexism: The interaction of emotion and gender attitudes in the 2016 US presidential election. Public Opinion Quarterly, 82, 799-821.
Van Erkel, P. & Turkenburg, E. (2020). Attitudes différentes, comportements électoraux différents, sentiments différents? La polarisation affective lors des élections 2019 en Belgique. In J.-B. Pilet, P. Baudewyns, K. Deschouwer, A. Kern & J. Lefevere (Eds.), Les Belges haussent leurs voix (pp. 167-186). Presses de l’Université de Louvain.
Vasilopoulos, P. (2018). Terrorist events, emotional reactions, and political participation: The 2015 Paris attacks. West European Politics, 41, 102-127.
Vasilopoulos, P. & Marcus, G. E. (2017). Deux voies vers la droite: Enjeux, émotions et vote FN. In O. Fillieule, F. Haegel, C. Hamidi & V. Tiberj (Eds.), Sociologie Plurielle Des Comportements Politiques (pp. 287-319). Les Presses de SciencesPo.
Vasilopoulos, P., Marcus, G. E. & Foucault, M. (2018). Emotional responses to the Charlie Hebdo attacks: Addressing the authoritarianism puzzle. Political Psychology, 39, 557-575.
Vasilopoulos, P., Marcus, G. E., Valentino, N. A. & Foucault, M. (2019). Fear, anger and voting for the far right: Evidence from the November 13, 2015 Paris terror attacks. Political Psychology, 40, 679-704.
Vasilopoulou, S. & Wagner, M. (2017). Fear, anger and enthusiasm about the European Union: Effects of emotional reactions on public preferences towards European integration. European Union Politics, 18, 382-405.
Verba, S., Petrocik, J. R. & Nie, N. H. (1976). The changing American voter. Harvard University Press.
Appendix -
1 To test our hypotheses, we rely on the RepResent panel survey. The survey is presented in length in the Introduction of this Special Issue.
-
2 Small differences in scores were for instance observed in bivariate analyses, i.e. scores obtained for small groups did vary slightly (e.g. ‘other party voters’ and ‘blank/null/abstention’ showing for instance less radical emotions when using weighted data).
-
3 A principal component analysis reveals slightly more complex patterns. Before rotation, two components emerge. One seems to capture the ‘type’ of emotions expressed (eigen value at 3.6, 45% of explained variance), with positive emotions loading positively (factor loadings between 0.75 and 0.84) while negative emotions loading negatively (factor loadings between -0.40 and -0.60). The second component (eigen value at 2.4, 30% of explained variance) seems to capture the ‘intensity’ of the emotions expressed, with all emotions loading positively but factor loadings being higher for negative emotions (between 0.61 and 0.72) than for positive emotions (between 0.36 and 0.47). After rotation – whether promax, varimax or oblimin –, two clear components emerge: one component on which positive emotions highly and positively load (factors around 0.8-0.9) while negative emotions negatively and weakly load (factors around -0.1 - -0.2); the other one on which negative emotions positively and highly load, but on which positive emotions negatively and weakly load.
-
4 Our comparisons of means throughout the article are based on Scheffé tests, as this test is quite conservative and is better suited for exploratory analyses (see Lee & Lee, 2018). We only consider significance levels below p < 0.05.
-
5 Note that when we exclude attitudinal variables from the models (satisfaction, trust and efficacy), the effect of the positive emotions index becomes significant (for CD&V, N-VA, OpenVLD, and sp.a in Flanders; and for cdH, MR and PS in Wallonia), and coefficients score around 1.2-1.3.
| Ref. category = VB | CD&V | Groen | N-VA | OpenVLD | PVDA | sp.a | Blank/null/abs. |
|---|---|---|---|---|---|---|---|
| Age | 1.04*** | 1.00 | 1.03*** | 1.01* | 1.00 | 1.03*** | 1.03** |
| Women | 1.02 | 0.87 | 1.19 | 0.96 | 0.90 | 1.18 | 1.03 |
| Education (ref.no/primary educ.) | 1.00 | 1.00 | 1.00 | 1.00 | 1.00 | 1.00 | 1.00 |
| Secondary school | 1.39 | 3.79* | 1.30 | 1.07 | 0.87 | 1.19 | 1.39 |
| Higher non-university degree | 3.83*** | 11.84*** | 2.27** | 2.52** | 1.96 | 1.47 | 1.70 |
| University degree | 5.50*** | 23.82*** | 3.36*** | 2.76* | 1.37 | 1.95 | 1.19 |
| Left-Right self-placement | 0.53*** | 0.34*** | 0.97 | 0.62*** | 0.30*** | 0.35*** | 0.57*** |
| Right socio-eco | 0.94 | 0.89 | 1.10* | 1.04 | 0.94 | 0.94 | 1.06 |
| Right immigration | 0.92 | 0.86** | 1.03 | 0.96 | 0.85** | 0.97 | 1.00 |
| Satisfaction with fed.gvt | 1.23** | 0.97 | 1.28*** | 1.11 | 0.90 | 0.92 | 0.90 |
| Trust index | 1.23* | 1.53*** | 1.10 | 1.30** | 1.20 | 1.50*** | 1.09 |
| External pol. Efficacy index | 1.05 | 1.30 | 0.93 | 0.99 | 0.81 | 0.94 | 0.87 |
| Anger | 0.85** | 0.90 | 0.92 | 0.92 | 1.11 | 0.95 | 0.99 |
| Bitterness | 1.02 | 0.95 | 0.90* | 0.93 | 0.90 | 0.95 | 0.93 |
| Worry | 1.03 | 1.16* | 1.04 | 1.04 | 1.07 | 1.09 | 0.98 |
| Fear | 0.96 | 0.87* | 0.95 | 0.93 | 0.88* | 0.96 | 1.00 |
| Hope | 1.12 | 1.18* | 1.08 | 1.04 | 1.13 | 1.02 | 1.05 |
| Relief | 0.93 | 0.93 | 0.89 | 0.98 | 0.91 | 0.85 | 0.96 |
| Joy | 0.89 | 0.87 | 0.98 | 1.02 | 0.91 | 1.12 | 1.12 |
| Satisfaction | 1.20* | 0.98 | 1.16* | 1.05 | 1.09 | 0.94 | 0.98 |
| N | 1,894 | ||||||
| McFadden pseudo R2 | 0.229 | ||||||
| Adj. McFadden Pseudo R2 | 0.191 | ||||||
Source: RepResent 2019 voter survey.
Note: Exponentiated coefficients; *p < 0.05, **p < 0.01, ***p < 0.001.
| Ref. Category = PTB | cdH | Ecolo | MR | PS | Other | Blank/null/abs. |
|---|---|---|---|---|---|---|
| Age | 1.04*** | 1.02* | 1.03** | 1.03** | 1.02* | 1.02* |
| Women | 1.15 | 0.99 | 1.20 | 1.09 | 1.10 | 1.08 |
| Education (ref.no/primary educ.) | 1.00 | 1.00 | 1.00 | 1.00 | 1.00 | 1.00 |
| Secondary school | 2.63 | 2.54* | 2.42* | 1.31 | 1.43 | 1.20 |
| Higher non-university degree | 4.24** | 4.26*** | 4.63*** | 1.11 | 1.85 | 1.30 |
| University degree | 4.07* | 6.50*** | 6.60*** | 1.57 | 2.74* | 0.67 |
| Left-right self-placement | 1.34*** | 1.14* | 1.88*** | 0.93 | 1.62*** | 1.40*** |
| Right socio-eco | 1.03 | 1.06 | 1.09 | 0.99 | 1.06 | 1.01 |
| Right immigration | 0.97 | 1.03 | 1.11 | 1.06 | 1.14** | 1.07 |
| Satisfaction with fed.gvt | 1.16 | 1.20** | 1.68*** | 1.04 | 1.07 | 1.01 |
| Trust index | 1.27* | 1.26** | 1.10 | 1.20* | 1.12 | 0.99 |
| External pol. Efficacy index | 1.20 | 1.27 | 1.35 | 1.70*** | 1.16 | 1.27 |
| Anger | 0.93 | 0.86* | 0.91 | 0.97 | 0.96 | 1.02 |
| Bitterness | 0.97 | 1.02 | 0.88* | 0.9 | 0.93 | 0.88* |
| Worry | 0.91 | 0.97 | 0.95 | 0.99 | 0.97 | 0.93 |
| Fear | 0.99 | 1.06 | 1.07 | 1.01 | 1.05 | 1.04 |
| Hope | 0.91 | 1.02 | 0.97 | 0.99 | 0.96 | 0.90 |
| Relief | 0.69** | 0.77** | 0.86 | 0.89 | 0.76** | 0.82 |
| Joy | 1.18 | 0.88 | 0.87 | 1.05 | 0.98 | 0.99 |
| Satisfaction | 1.44** | 1.28* | 1.34** | 1.15 | 1.26* | 1.36** |
| N | 1,355 | |||||
| McFadden pseudo R2 | 0.177 | |||||
| Adj. McFadden Pseudo R2 | 0.131 | |||||
Source: RepResent 2019 voter survey.
Note: Exponentiated coefficients; * p < 0.05, **p < 0.01, ***p < 0.001.
| Anger | Bitterness | Worry | Fear | Hope | Relief | Joy | Satisfaction | |
|---|---|---|---|---|---|---|---|---|
| CD&V | +0.58 | +0.41 | +0.37 | +0.45 | -0.40 | -0.57 | -0.51 | -0.80 |
| Groen | +0.17 | +0.24 | +0.35 | +0.87 | -0.27 | -0.23 | -0.09 | -0.43 |
| N-VA | +0.29 | +0.36 | +0.04 | +0.21 | +0.04 | -0.05 | -0.21 | -0.33 |
| OpenVLD | +0.36 | +0.27 | +0.23 | +0.46 | -0.51 | -0.59 | -0.59 | -0.48 |
| PVDA | +0.08 | 0.00 | -0.08 | +0.09 | -0.06 | +0.17 | +0.13 | +0.11 |
| sp.a | +0.15 | +0.19 | +0.21 | +0.48 | +0.06 | +0.09 | +0.06 | -0.10 |
| VB | +0.23 | -0.08 | -0.12 | -0.33 | +0.41 | +0.29 | +0.27 | +0.02 |
| Blank/null/abs. | -0.06 | -0.07 | -0.42 | -0.31 | -0.33 | -0.22 | -0.50 | -0.47 |
| Mean | +0.24 | +0.18 | +0.07 | +0.19 | -0.04 | -0.09 | -0.14 | -0.28 |
| Sig. | - | - | - | *** | *** | *** | *** | *** |
-: not significant; p < 0.05, **p < 0.01, ***p < 0.001.
Source: RepResent 2019 voter survey.
| Anger | Bitterness | Worry | Fear | Hope | Relief | Joy | Satisfaction | |
|---|---|---|---|---|---|---|---|---|
| cdH | +0.61 | +0.51 | +0.29 | +0.51 | +0.11 | +0.47 | +0.17 | +0.27 |
| Ecolo | +0.18 | -0.08 | -0.07 | +0.20 | +0.07 | 0.00 | +0.27 | +0.18 |
| MR | +0.32 | +0.31 | +0.05 | +0.26 | +0.08 | -0.22 | +0.29 | -0.04 |
| PS | -0.08 | -0.04 | +0.10 | +0.24 | +0.48 | +0.49 | +0.43 | +0.64 |
| PTB | -0.19 | +0.02 | -0.03 | +0.12 | +0.35 | +0.20 | +0.39 | +0.42 |
| Other party | -0.05 | +0.09 | -0.09 | +0.05 | -0.05 | +0.18 | +0.25 | -0.03 |
| Blank/null/abs. | -0.25 | +0.30 | -0.33 | +0.04 | -0.43 | -0.28 | -0.11 | -0.32 |
| Mean | +0.05 | +0.11 | -0.01 | +0.19 | +0.13 | +0.12 | +0.27 | +0.19 |
| Sig. | - | - | - | - | * | ** | - | *** |
-: not significant; p < 0.05, **p < 0.01, ***p < 0.001.
Source: RepResent 2019 voter survey.