

-
1 Introduction
In most systems of Proportional Representation (PR) systems, voters are offered a choice not only between parties, but also between candidates. These votes for individual candidates are called preference votes. Preference votes are one of the key features in open and flexible PR-list systems (including Belgium and the Netherlands), in which they have (at least formally) an impact on who will be elected (Reilly, Ellis & Reynolds, 2005). Moreover, they also have an indirect impact, as party selectors often take the number of preference votes into account when allotting other positions, such as government positions and the list positions at the next elections (André, Depauw, Shugart & Chytilek, 2017).
Preference votes are also highly relevant for several academic discussions as they touch upon a wide range of politically relevant phenomena such as the personalization of politics (Karvonen, 2010; Wauters, Thijssen, Van Aelst & Pilet, 2018), party decline (Cross, Katz & Pruysers, 2018), parliamentary behaviour (Bräuninger, Brunner & Däubler, 2012), political careers (André, Depauw, Shugart & Chytilek, 2017; Folke, Persson & Rickne, 2016), campaign behaviour (Maddens & Put, 2013; van Erkel, Thijssen & Van Aelst, 2017) and the representation of social groups such as women and ethnic minorities (Erzeel & Caluwaerts, 2015; Holli & Wass, 2010; Marien, Schouteden & Wauters, 2016; Teney, Jacobs, Rea & Delwit, 2010). In the last few decades, research on this topic has expanded enormously in the Low Countries because of the range of multifaceted options embedded in their electoral systems. In this respect they are often considered an interesting laboratory for international students of preference voting. It is the aim of this article to take stock of what we actually know about this phenomenon in Belgium and the Netherlands.
We will begin by discussing why preference voting can mean different things depending on the electoral opportunity structure of a country. Once the contextually varying meaning of a preference vote is clear, we will focus on two sides of the phenomena: the demand side (i.e. which voters cast a preference vote) and the supply side (i.e. which candidates win more preference votes). For the former, we will evaluate both aggregate and individual effects on the likelihood of casting a preference vote. For the latter, we will link the varying dependent variables to the distinct explanatory variables that have been explored in different studies. We conclude by offering some avenues for further research. -
2 Preference Votes as Concept
Before we begin our overview of studies on preference voting, we first discuss the meaning of preference votes in Belgium and the Netherlands.
Belgium is generally characterized as a flexible-list PR system. Voters can either vote for one or more individual candidates (on the same list) or cast a list vote, thereby endorsing the order of candidates. This means that in Belgium one can distinguish not only between list voters and preference voters, but also between different types of preference voters. Generally, three types are discerned. Preference voters can a) vote only for the first candidate on the ballot list, i.e. the list puller, b) vote for one or more candidates that do not occupy the first position on the list, or c) combine these two types and vote for the list puller and at least one other candidate. Different explanatory models are used for each kind of preference voter (André, Pilet, Depauw & Van Aelst, 2013; Thijssen, Wauters & Van Erkel, 2018). Another distinction that is sometimes made is that between ‘centralized’ and ‘decentralized’ preference voting (Balmas, Rahat, Sheafer & Shenhav, 2014). Although other operationalizations are possible, centralized preference voting refers to a vote for the party leader, whereas decentralized preference voting refers to a vote for any of the other candidates. Wauters et al. (2018) show that centralized preference voting has increased, while decentralized preference voting has decreased over time.
Preference votes formally impact who will be elected in Belgium. All candidates reaching the eligible quota on the basis of their preference votes automatically obtain a seat. In general, however, only very few high-ranked candidates reach that number. The eligibility number is calculated by dividing the total number of votes a party obtains by the number of seats + 1 obtained by that party. For the local elections, all party votes are first multiplied by the number of seats for that party and then divided by the number of party seats + 1. For all others, list votes are added to their personal votes until they reach the quota, following the order of the candidate list. A result of this system is that individual candidates, on the basis of their preference votes, can ‘jump over’ higher listed candidates. On the national and regional level this only happens sporadically. To illustrate, between 1987 and 2014 only 3.4% of all elected national MPs of Flemish parties were elected out of the list order (Put, Smulders & Maddens, 2014). This number peaked in 2003 (following electoral reforms), with 10 candidates, while previously (since 1987) none had been elected out of the list order, and after 2003 this number has again decreased: e.g. in 2014 only 2 candidates jumped over higher ranked candidates. As a result, Belgium’s electoral system has sometimes been characterized as a ‘closed-list system in disguise’ rather than as a ‘flexible-list system’ (Crisp, Olivella, Malecki & Sher, 2013). On the local level, however, the list order is less decisive: only 0.5% of all elected local councillors in Flanders in 2018 would not be elected if there were no list votes (Agentschap Binnenlands Bestuur, 2019). In addition, owing to several reforms, the influence of list votes has been gradually cut back, also on the regional and national level. Furthermore, André, Depauw, Shugart & Chytilek (2017) demonstrate that preference votes also have an important indirect effect, influencing politicians’ career prospects. Selectors do take a candidate’s previous electoral performance into account in future selection procedures in which positions on the candidate list or government positions are allotted.
In the Netherlands, voters’ options regarding preference votes are more constrained. Unlike Belgium, voters in the Netherlands do not have the option to cast a list vote, but are always forced to cast a vote for one single candidate on a party list (Nagtzaam & Van Erkel, 2017). Moreover, one cannot vote for multiple candidates. These differences mean that conceptually there is more discussion on what constitutes a preference vote in the Netherlands. To some extent, every vote could be considered a preference vote. Others argue that only votes cast for candidates that are not the ‘list puller’ should be considered preference votes (Van Holsteyn & Andeweg, 2012). Thus, the main difficulty in conceptualizing preference votes in the Netherlands is what to do with votes for list puller. Some of these votes may be actual preference votes, whereas others may simply be votes to support the party as a whole, rather than that specific candidate.
In an attempt to gain insight into the extent to which votes for the party leader are party voters or personal votes, Van Holsteyn and Andeweg (2010) conducted a counterfactual thought experiment in which they asked respondents if they would still vote for the party leader if that leader did not occupy the first position on the list. They show that about 25 to 30% of the respondents would still vote for the leader even if he or she was on a lower ballot position and that these votes can thus be defined as preference votes, although this number fluctuates strongly between party families. A more recent experiment by Nagtzaam and Van Erkel (2017), which looks at what happens when Dutch voters would have the option to cast a list vote, demonstrates that about 20% of the voters would also use this option. Even more interesting is that the percentage of voters who would use this option is more or less equal between citizens voting for the list puller and citizens voting for a candidate on position two or lower. In that sense, the claim that votes for a non-list puller are pure preference votes should be further nuanced. Taken together, it is difficult to find an unambiguous operationalization of preference voting in the Netherlands. Studies investigating preference votes should therefore always make clear whether they refer to votes for all candidates or votes only for candidates that are not heading the list (these candidates are called ‘list pullers’).
If we look at the impact of preference votes in the Netherlands, we see that the system is even more closed than that in Belgium. In principle, seats are distributed on the basis of the ballot list order. Only when candidates cross the threshold of 25% of the electoral quota, that is 25% of 1/150 of all votes cast, will they be elected automatically. While in every election some candidates manage to pass this threshold, most of them would have been elected by the list order anyway. In general, in most Dutch elections only one or two candidates manage to get elected purely by preference votes, although 2017 was rather an exceptional case, with four candidates. Compared with Belgium, it is the Netherlands that can aptly be called a ‘closed-list system in disguise’. -
3 Which Voters Vote for Candidates? (The Demand Side)
We now look at preference voting from the perspective of the voter. The use of preference voting can be investigated either at the individual or at the aggregate level. We start with the aggregate level, where elections are compared with each other, either across time or across type of elections.
The use of preference votes for the House of Representatives and for the local councils in Belgium (Wauters, Pittoors & Moens, 2019)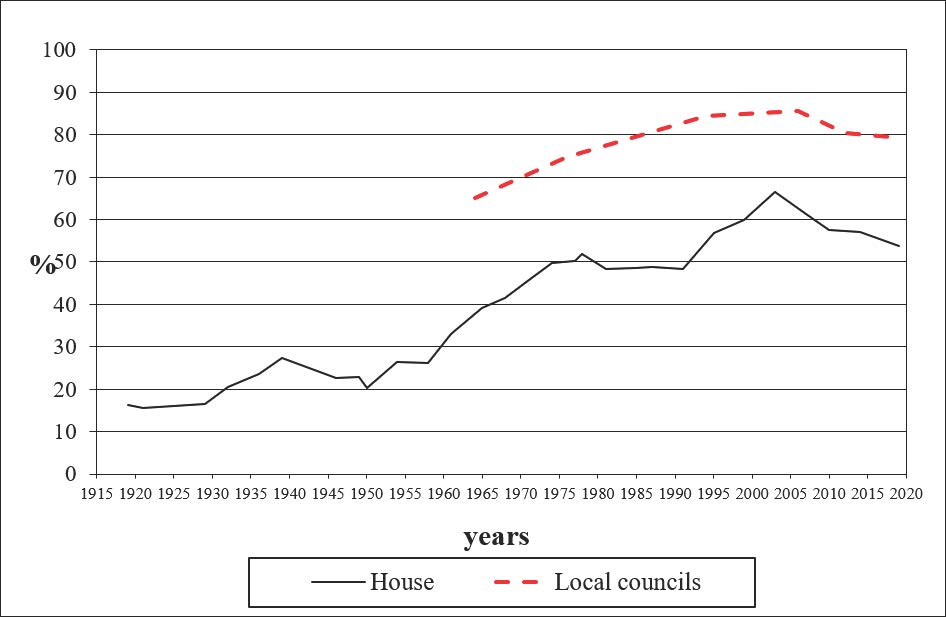
The strong increase over time in Belgium is striking (Figure 1). Whereas in 1919 only 16% of the voters cast a preference vote for the House, this increased to 66% in 2003. However, from 2003 onwards a clear and steady decline can be noted, bringing the percentage of preference voters back to 53%. This can be explained by the rise in centralized personalization, which refers to voting for the party leader instead of for other candidates (see above), but also by the rise of new parties that do not have many well-known figures (Wauters et al., 2018). Another striking element is the difference between local and national elections. The use of preference voting is clearly higher in local elections. In the most recent local elections (2018), about 80% of the voters cast a preference vote, compared with only 53% for the 2019 House elections, although we should also note that there has been a slight decrease in recent local elections. Researchers point to the concept of ‘social distance’ as an explanation for differences between local and national elections (Thijssen et al., 2018; Wauters, 2000; Wauters, Verlet & Ackaert, 2012). At the local level, voters and politicians have more face-to-face contacts, resulting in a higher level of familiarity with politicians (and thus more preference voting). This is confirmed by the fact that in rural areas (with more informal contacts between voters and politicians) preference voting is more extensive than in urban areas.
Notwithstanding some fluctuations, Figure 2, on the Netherlands, also shows a clear upward trend. While immediately after World War II less than 5% of voters casted a vote for a candidate that was not at the top, this percentage has risen to above 25% in 2002. In more recent years we see a decline similar to what we observed in Belgium. However, in 2017 we again see a sharp increase, which is unparalleled in Belgium. Note that these percentages are much lower than the Belgian ones. This could be explained by the different operationalization of preference votes. As, unlike Belgium, only votes for other candidates than the list puller are included.The use of preference votes (i.e. a vote for other candidates than the ‘list puller’) in the Netherlands for the national parliament (‘Tweede Kamer’) (Lindqvist, 2018) Overview of studies on the use of preference voting: variables included and their effects Overview of studies on the use of preference voting: variables included and their effects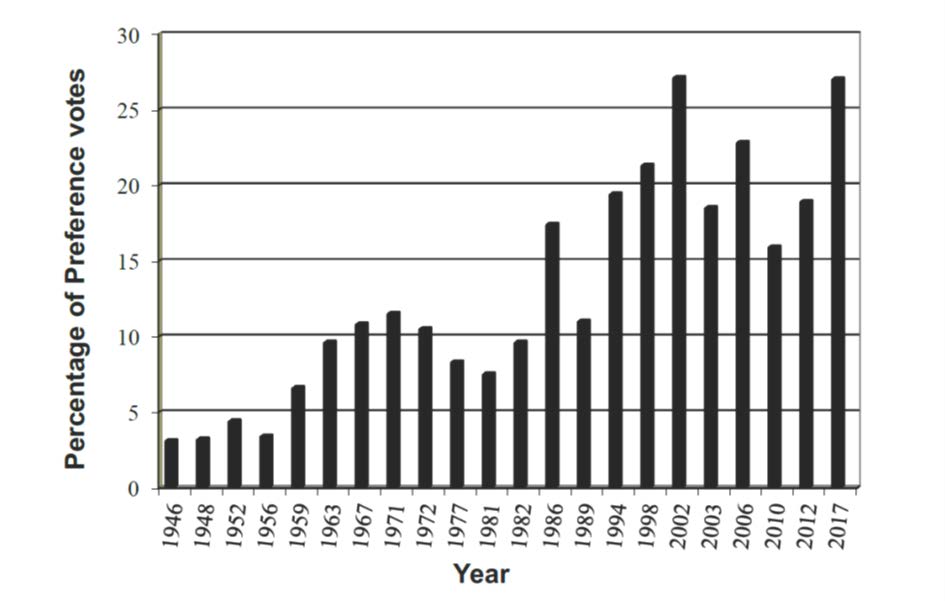
We now look at individual factors that explain the use of preference votes. We compare several studies in order to obtain a list of strong predictors on whether a voter casts a preference vote. We show only the results for the full models (including all relevant variables) that were presented in these studies. Not all studies focus on preference voting versus list voting (Thijssen et al., 2018). This reflects the discussion of several types of preference votes we referred to in Section 2. Of all kinds of preference votes in Belgium, we take the combination of a preference vote for the list puller and for other candidates as dependent variable, because this comes closest to the general concept of preference voting (versus list voting). For the Netherlands, preference votes are votes cast for candidates that are not the ‘list puller’ (see above).
We follow André et al. (2012) and categorize variables in four explanatory models: the resource model, the proximity model, the instrumental model and the identity model (see Table 1).
Table 1 Overview of studies on the use of preference voting: variables included and their effectsStudy André, Wauters, and Pilet (2012) André et al. (2013) Thijssen et al. (2018) Van Holsteyn and Andeweg (2012) Country and level B (reg) B (loc) B (nat + loc) NL (nat) Resources model Political interest + + + + Internal political efficacy + Political knowledge + Political cynicism Ns Education Ns Ns Ns + Employment (and social class) Ns Ns Identity model Age + – + – Non-European origin + Female Ns + + + Proximity model Interest group membership + Party membership + Ns Contact over casework + Personal contact + Local level + Instrumental model Party magnitude + Ns Flanders – + Controls Late decision + Traditional party + Level of urbanization – + Ns Local identity + Well-known politician on list + Ns + denotes a positive significant effect, – means a negative significant effect, Ns denotes a non-significant effect, a blank means that the variable was not included in the analysis.
3.1 Resource Model
The resource model states that the propensity to cast a preference vote is related to voters’ political resources (e.g. political interest) as well as socio-demographics that usually correlate with these resources (level of education, social class, age, sex and ethnic origin).
Political interest appears to be the factor that has a consistent (positive) significant effect across analyses, both in Belgium and in the Netherlands. To date, other attitudinal resource variables have not yet been directly tested in Belgium, but Van Holsteyn and Andeweg (2012) find that Dutch voters with a higher political internal efficacy and more political knowledge are also more likely to cast a preference vote.
Unlike political interest, most socio-demographic variables often associated with political resources have almost no significant effects. This might be because their effects are already incorporated by political interest. Apparently, level of education does not provide an extra explanation for preference voting behaviour over and above the effect of political interest (at least in Belgium). A second explanation of the lack of effect could be the focus of a number of studies on local elections. Thijssen et al. (2018) point in their analysis to the fact that socio-demographic differences in the use of preference voting are less outspoken in local elections than in national elections. The distance to local politicians is smaller, which helps voters from all layers of society to cast preference votes. Finally, negative effects for some socio-demographic groups according to the resource model can be overtrumped by effects of the identity model (see below). This is probably the case for age, which shows very mixed results. Whereas age could be related to resources (older people are more familiar with the political system and the candidates), it could also refer to identity-related motives (young voters supporting young candidates). The latter particularly appears to be the case for local elections and for preference votes for candidates other than the list puller (such as in the Netherlands).3.2 Identity Model
This brings us to a second model that states that voters cast a preference vote for candidates with whom they identify. They could use the socio-demographic background of candidates as a heuristic cue to deduce the policy positions of a candidate (people belonging to the same group as I do will have similar views), or it could be a purposive strategy to increase the presence of these under-represented groups. Research on group-based voting behaviour have indeed shown that women are (slightly) more likely than men to vote for women (Erzeel & Caluwaerts, 2015; Marien et al., 2016; van Erkel, 2019) and that voters with a migration background are more likely to vote for candidates with that background (Jacobs, Kelbel & Pilet, 2013; Teney et al., 2010). Our overview also confirms that women and ethnic minority people are more inclined to cast a preference vote.
3.3 Proximity Model
The third model states that people will cast a preference vote for someone they know personally. This is also the explanation for the higher share of preference voters at local elections. Other proxies for proximity include being a party member and a member of a voluntary association. More direct measures of having personal contact with candidates have also been used. The general picture in Belgium is that all these variables do indeed have a significant effect. For the Netherlands, so far, only party membership was tested, and it did not have a significant effect.
3.4 Instrumental Model
According to this model, voters cast a preference vote because they want to impact the allocation of seats to individual politicians. André and Depauw (2017) indeed show in a comprehensive, cross-national study that the failure of preference votes to affect the allocation of seats dissuades voters from casting a preference vote. Other studies hypothesized that voters cast more preferential votes in districts with a higher magnitude (i.e. a high number of candidates) as in these districts it is easier for low-positioned candidates to pass their peers. Thijssen et al. (2018) indeed find that in districts with higher magnitude voters are more likely to cast a preferential vote, but that this is mainly because these districts tend to have a more popular list puller and not because of strategic motives. The same logic could also apply for party magnitude (the number of seats a party obtains), for which some studies have found a positive significant effect. Other studies also question the effect of strategic motives. For instance, despite the fact that preference votes have a larger formal impact in Wallonia on deciding who will become mayor, André et al. (2013) find that the share of preference voters is larger in Flemish municipalities. Wauters et al. (2012) also could find no increase in preferential voting after an electoral reform that in principle should have stimulated it.
In sum, the limited number of studies on the profile of preference voters confirms the effects of political interest (as part of the resource model) as well as the effects of the identity and proximity models. Effects of the instrumental model are, however, more doubtful. -
4 Who Obtains Preference Votes? (Supply Side)
In this section, we look at preference votes from the side of the candidates. In particular, we explore studies that predict individual electoral success of candidates. We first explore some methodological challenges. Subsequently, we focus on the factors that explain individual electoral success.
4.1 How to Measure the Number of Preference Votes?
In the Netherlands, there is not much discussion on the operationalization as the few studies on this topic simply use the absolute number of preference votes of a candidate as dependent variable (Spierings & Jacobs, 2014; Van Holsteyn & Andeweg, 2012). However, as mentioned above, Belgian voters can cast multiple preferential votes (or simply cast a list vote). Moreover, Belgium has electoral districts that have widely divergent district magnitudes. Simply using absolute number as in the Netherlands is no option then. Obtaining 1,000 preference votes in a district with a small district magnitude is much harder than obtaining 1,000 votes in a larger district. In addition, an equal level playing field might also be absent because the number of competing parties differs quite a lot; this is the case in local elections where not all national parties always participate in each municipality. The quality of the party competition is also different: in the electoral district where a party’s national figurehead is on the list, more preference votes are cast (Wauters et al., 2018). Although these problems could, to some extent, be solved by incorporating fixed controls for party and district magnitude, this is not optimal. In many analyses it was not possible to give an adequate interpretation of their effects, given that no robust standard errors were used.
The practical consequence is that Belgian analyses should use some form of normalization in order to allow for comparisons of individual success across districts. Different normalization procedures have been used. The discussion was opened by Dewachter (1967) more than fifty years ago. He developed two formulas to calculate a score for each candidate (the 1000-scale and the 500-scale). These scores took into account both absolute and relative numbers of preference votes and controlled for both the size of the district and the strength of the party. Although these formulas worked quite well initially, owing to electoral reforms (such as the enlargement of electoral districts) and changing electoral behaviour (the increase in the use of preference votes), this was no longer the case. Wauters and Weekers (2008) even demonstrated that rather than controlling for these effects, the scale scores correlated with the size of the district and the size of the party.Table 2 Overview of the methodologies of supply-side studies on preference votingSupply-side studies Geys and Heyndels (2003) Wauters, Weekers, and Maddens (2010) Spierings and Jacobs (2014) Thijssen (2013) Maddens and Put (2013) Put and Maddens (2015) Put, Maddens, and Smulders (2015) Van Erkel and Thijssen (2016) Van Erkel et al. (2017) Van Erkel, Van Aelst, and Thijssen (2018) Bouteca, Smulders, Maddens, Devos & Wauters (2019) Van De Voorde (2019) Joly, Soroka, and Loewen (2019) Van Erkel (2019) Van Holsteyn and Andeweg (2012) Preference voting Country Belgium X X X X X X X X X X X X X Netherlands X X Election level National X X X X X X X X X X X X X Local X X X Dependent variable Absolute numbers X X List proportions X X X X District proportions X X X X X X X X Logged X X X X X X X X Beta regression X Independent controls Party magnitude X X X X X X X District magnitude X X X X X X Pref.vote proportionPer party/district X X X X Avg. Pref. vote prop.Per district X X X Fixed party control X X Fixed district control X X Clustering control Robust SE X X X X Multilevel X X means that it is applicable to and/or present in the analysis
Another approach is needed. Two options are available: one can divide the absolute number of preference votes by the total number of preference votes in a district (i.e. the district proportion), or one can divide it by the total number of preference votes for a given party in a district (i.e. the list proportion) (Wauters et al., 2019). In general, a list proportion is more suitable when one focuses on intra-party competition, as it measures the electoral score of a candidate relative to other candidates of the same party. A district proportion is suitable to analyse both intra-party competition and inter-party competition, as it also takes into account the score of candidates from other parties within that district. For instance, van Erkel and Thijssen (2016) focus on the role of ballot list position. Given that this is relevant mainly for intra-party competition, list proportions are used. Candidates at a top position are unlikely to attract voters from other parties simply owing to their position, as these other parties also have candidates at a top position. Conversely, when van Erkel et al. (2017) study the effect of personalized campaigning, it makes sense to take the inter-party competition also into account, as by means of a personalized campaign strategy, certain candidates may win over voters from another party. Therefore, in this analysis district proportion serves as the dependent variable. As far as we know, Put et al. (2015) provide the only study that systematically compares the results of analyses based on list proportions with those based on district proportions. Their results show that the differences in effects are limited.
4.2 Which Candidates are Taken into Account?
Another issue is the question of whether it makes sense to take all candidates and all lists into account or only a selection of them when analysing preference votes. In the Belgian system the former option means that many individual scores should be taken into account because in each district parties can field as many candidates as there are seats to be allocated. As Put et al. (2015) point out, the candidature for the vast majority of candidates is merely symbolic as most of them have no real chance of becoming elected. In this respect, when investigating the effect of variables such as media exposure and campaign expenses, it makes sense to conduct the analysis for a more limited number of ‘realistic’ or ‘marginal-realistic’ candidates (Put & Maddens, 2013).
The question then is how to delineate this group of ‘realistic’ candidates. There are three options: researchers themselves, external observers or party selectorates can make this selection. The first option carries the risk of being very arbitrary and is therefore not used in Belgium or the Netherlands. For the second option, researchers could, for instance, rely on journalists (e.g. candidates not mentioned at least once in a newspaper in the months preceding the elections were not considered as ‘realistic’ by Maddens, Wauters, Noppe, and Fiers (2006)). But most often, researchers rely on the judgement of the party selectorates and take the list position as a criterion for delineation. Put and Maddens (2013) define the first k positions on the list as realistic positions, where k equals the total number of seats won at the previous elections. Position k+1 and the position of the list pusher are marginal positions.
However, this current approach can be criticized for several reasons. First, these criteria are rather static and do not take into account increased electoral volatility. Secondly, especially in local elections where significant numbers of lowly ranked candidates manage to become elected, these criteria might be too selective (as Put & Maddens themselves acknowledge). Thirdly, it might be interesting to incorporate both in order to compare effects. van Erkel et al. (2018), for instance, show that short-term media effects are more outspoken for ‘ordinary candidates’, while long-term effects are more beneficial for top candidates. In sum, the distinction between ‘realistic’ and ‘ordinary’ candidates (and varying effects for both groups) merits more research attention.4.3 Controlling for the Context?
While the main focus in studies on the number of obtained preference votes is on individual and party characteristics (see below), candidates are always embedded in a context. Therefore, their success is also influenced by the electoral system, the district in which they run and the characteristics of the other candidates on the list.
Although Belgium and the Netherlands both use a PR flexible-list system, there are some differences, e.g. in terms of the availability of list votes and of multiple preference voting (both only in Belgium) and the availability of a single national district (only in the Netherlands). As we explained above, ballot rank order effects may be stronger in the Netherlands than in Belgium, and it is likely that the difference between realistic and unrealistic candidates is more important there. Indeed, Spierings and Jacobs (2014) note that the list puller effect ‘clearly dwarfs all other effects’. In addition, owing to the absence of list votes in the Netherlands, differences between centralized (first-order) personalization and (second-order) depersonalization might be more pronounced there (Wauters et al., 2018).
Also, the impact of district-related differences might be more outspoken in Belgium, simply because there are several districts with different voter populations, candidates and sometimes even parties. Previous research showed that two particular features of the district stand out in influencing preference votes: district magnitude (i.e. the number of candidates running in a district) and district size (see also Section 3). van Erkel and Thijssen (2016) control for these district characteristics by adding fixed effects. Other studies add (control) variables such as district magnitude (e.g. Put et al., 2015) or the average number of preferential votes at the district level (Wauters et al., 2010).
The success of a candidate may also depend on the other candidates on that list. As stated earlier, this will be more limited in Belgium because citizens can cast multiple preference votes. A candidate with a migration background or a minister may profit more if he or she is the only one with this feature on the list. van Erkel (2019) cross-sectionally tested for such composition effects by including interactions between candidate characteristics and the ballot composition of those characteristics. These tests did not give any indication of a ballot list composition effect. More fine-grained and over-time analyses are, however, necessary to confirm these results.4.4 Factors Influencing the Number of Preference Votes for Candidates
Partially inspired by the influential study of Carey and Shugart (1995), the explanatory factors in electoral research are often subdivided into three categories: party vote-earning attributes (PBVEAs), individually based vote-earning attributes (IVEAs) and media-based vote-earning attributes (MBVEAs).
Table 3 Overview of studies about which candidates obtain preference votesSupply-side studies Geys and Heyndels (2003) Wauters et al. (2010) Spierings and Jacobs (2014) Thijssen (2013) Maddens and Put (2013) Put & Maddens (2015) Put et al. (2015) Van Erkel and Thijssen (2016) Van Erkel et al. (2017) Van Erkel et al. (2018) Van Erkel (2019) Joly et al. (2019) Bouteca et al. (2019) Van De Voorde (2019) Van Holsteyn and Andeweg (2012) Preference voting Independent controls Party magnitude X X X X X X X District magnitude X X X X X X Pref.vote proportionPer party/district X X X X X Avg. Pref. vote prop. X X X Fixed party control X X Fixed district control X X X Time X Independent variables Woman + Ns + + Decr. – + + + (netto) + + + First woman + Ns Shared gender + Ethnic + + + + Ns + First Ethnic + Age – Ns Ns + Ns Age similarity voter and candidate Ns Profession Ns (educ) (–) civ. serv. Ballot position + – + Decr. + + + + + + + 1st position on list + + + + + + + + + + + + 2nd position + + + + + + + + 3rd position + + + + + + + + 4th position + + + + + + Penultimate position Ns + + Last position Ns Ns Ns + + + + + + + Ns + + 1st succ.list Ns 2nd succ. List Ns Last position succ. Ns Other position succ. – Critical position computer + Campaign expenses + Ns + + Ns Ns Campaign expenses² – Ns Ns – Ns Party campaign expenses Ns Personal campaign expenses + High max – Campaign experience Ns Incumbency + Ns + + + + + + + + + Local – National + (+) (mayor) + + Pol seniority + Dual office Ns Ns Municipality size of candidate + Shared municipality candidate and voter + + Celebrity + Media exposure + + + + In the long campaign + In the short campaign + New media exposure + Quality of parl work Newspaper scores + # parl activities + (only opposition) Personality + + denotes a positive significant effect, – means a negative significant effect, Ns denotes a non-significant effect, a blank means that the variable was not included in the analysis.
4.4.1 Party Vote-earning Attributes
In general, this category consists of four factors: party affiliation, party campaign, partisan selection procedures and ballot list position.
The first factor, party affiliation, has a strong influence on the success of candidates. Candidates belonging to electorally more successful parties have an electoral advantage over those from smaller parties. To some extent this relationship is endogenous, as the success of the individual candidates also shapes the success of their party. Nevertheless, research shows that, in general, the party still comes first. According to Van Holsteyn and Andeweg (2010) and André, Depauw, and Pilet (2017), most voters first decide which party to vote for and then decide which candidate to support within that party. They also indicate that when the candidate belonged to a different party, he or she would not have received their vote (Van Holsteyn & Andeweg, 2010). The size of the party is mostly included in the analyses as a control variable (see Table 3).
Additionally, the potential of preferential votes may also be influenced by the ideology of the party. We can expect that the electorate of parties based on a more collectivistic ideology, such as the social-democrats or Christian-democrats, may base their vote more on the ideology of the party than on the electorate of parties with a more individualistic ideology, such as the liberal-democrats (De Winter & Baudewyns, 2015), but this not confirmed by empirical analyses. Rather, it appears that the rate of preference voting is determined by the tradition of the party. Preference voting is clearly lower for new parties that have a weaker party structure and mobilize their voters more often around one issue (Wauters et al. 2018, 2019).
A second category of partisan explanatory factors revolve around campaigning. In PR systems, most studies focus on the amount of money candidates spend. Maddens et al. (2006) find evidence that the more money candidates spend on their campaign, the more preference votes they obtain. This finding has been consistently confirmed by other studies later on (see Table 3). Put et al. (2015) show that campaign money also matters at the local level. One can also wonder whether the content of the campaign and the strategy behind it matters. A recent collection of studies shows that there is considerable variation in campaign styles between candidates in systems with preference voting. We can distinguish party-centred campaigns from personalized campaign strategies (De Winter & Baudewyns, 2015; Zittel & Gschwend, 2008). Van Erkel et al. (2017) demonstrate that especially the latter strategy results in more preference votes, with politicians relying on personal money being more successful than those relying on party money.
A fourth and last party-related factor is ballot list position. Especially in flexible systems, this is a party-related factor because party selectorates essentially determine which candidate gets which position. Studies (see Table 3) consistently show that candidates placed in a higher ballot list position, receive more votes than candidates in a lower position, both in Belgium and in the Netherlands (e.g. Geys & Heyndels, 2003; Thijssen & Jacobs, 2004). However, it is not only candidates on the first list position that benefit but also those in other high list positions, though in the case of the latter the benefit is smaller. An exception to this pattern is the last position, the so-called ‘list-pusher’, which is also able to attract more votes. Yet, although the effect of ballot list position is consistent among studies, questions remain as to how this effect exactly works. van Erkel and Thijssen (2016) demonstrated that the electoral benefit continues even when controlling for other vote-earning attributes of candidates. In other words, it is not only because party selectors did a good job in selecting popular candidates for top positions and because top candidates receive more attention in the media that they obtain most votes, but also because of what seems to be a psychological bias of the electorate towards this option, the so-called primacy effect. Devroe and Wauters (2018) point in this respect to ‘voter perception effects’: the list position of a candidate functions as a heuristic cue for competence: candidates selected for a high list position are perceived as more competent by voters, which yields more votes.4.4.2 Individual-based Characteristics
Candidates have different personal-based characteristics that could explain why they perform electorally better than other candidates. The literature has focused mostly on two types of characteristics: socio-demographic characteristics and political experience.
The extent to which socio-demographic characteristics shape the electoral success of candidates has received ample attention. Especially the effect of gender and ethnicity has also attracted a lot of research in the Low Countries, but evidence is mixed (see Table 3). In regard to the descriptives alone, studies show that women (Wauters, Maddens & Put, 2014; Wauters et al., 2010) and candidates with a migration background (Bergh & Bjørklund, 2011; Thijssen & Jacobs, 2004) receive significantly fewer votes. Yet this is mostly due to structural differences between socio-demographic groups on other factors, such as their ballot list position and media attention. Wauters et al. (2010) show that once we control for these structural inequalities, there is no difference between male and female candidates. Thijssen and Jacobs (2004), Bouteca et al. (2019), Thijssen (2013) even find that when controlling for all other factors, candidates from minority groups such as women and ethnic minority candidates perform electorally better. Their reasoning is that these under-represented groups develop a stronger social identity and are therefore more inclined to vote for someone from the in-group. In a recent study van Erkel (2019) is the first to systematically combine voter (demand) and candidate (supply) characteristics in one model, allowing one to better grasp the decision-making process of voters. He establishes that, controlling for structural inequalities between candidates, the effect of a voter sharing the same gender with a candidate on the likelihood of a voter also casting a preference vote for that candidate is indeed stronger for women.
A second personal-based factor is political experience. The finding of an incumbency advantage is one of the strongest findings in research on preference voting. Ministers, mayors and MPs are better known than new candidates and therefore benefit from this name recognition effect, especially considering that voters are unlikely to vote for candidates whom they do not know. In addition, incumbent candidates can show their skills and, in that sense, build a reputation. It is therefore no surprise that all studies on preference voting indeed find clear evidence for an effect of political experience both in Belgium and in the Netherlands (with the exception of dual office holding, see Van de Voorde (2019)).
A third, rather new, category is personality traits. Joly et al. (2019) point out that less agreeable and more emotionally stable Belgian MPs obtain significantly higher proportions of preference votes. This is, as far as we know, the only study that has investigated the effects of personality traits.
Finally, recent research also investigated the local vote, testing whether candidates are more likely to attract votes from their home base. Put and Maddens (2015) indeed find that candidates from a larger municipality win more votes, although this effect is modest. Van Erkel (2019) also finds that the local vote matters and demonstrates that voters are more inclined to cast a preference vote for a candidate from their own municipality.4.4.3 Media-Based Vote-Earning Attributes
In many cases, citizens can learn about party-related and personal characteristics only through the media, as for most citizens the mass media is the most important channel of information. Many studies have pointed out that visibility and tone in election news coverage influence party choice (Hopmann, Vliegenthart, De Vreese & Albæk, 2010). There are reasons to expect that the media also impacts on choice between candidates, as media attention creates a feeling of proximity between candidate and voter. When evaluating the ballot list, voters are more likely to select a candidate they ‘know’, giving an advantage to candidates who receive more media attention. Only three studies have provided some evidence that media attention indeed plays a role. Maddens et al. (2006) include newspaper articles in their model as a control variable and find a significant positive effect. The same phenomenon (significant effect of media exposure) was found in a follow-up study focusing on women (Wauters et al., 2010). A study by Van Aelst, Maddens, Noppe, and Fiers (2006) focuses more specifically on media attention and also finds evidence that more coverage in newspapers results in more preference votes. Very recently van Erkel et al. (2018) have found that media attention in the long campaign, i.e. the year before the election, matters more for top candidates, while media attention in the short campaign (i.e. the month before the elections) is more important for ‘ordinary’ candidates.
Not only may the traditional media help candidates to win preference votes, but social media also may increasingly play a role. Yet surprisingly little research has investigated the influence of social media on a candidate’s success. To our knowledge, this effect has been investigated only in the Netherlands by Spierings and Jacobs (2014) and Kruikemeier (2014). The former study finds that whereas simply having followers on social media does not increase one’s electoral success, there is a positive interaction between being active and one’s number of followers. Politicians who actively post on social media and have a lot of followers will benefit. The latter study demonstrates that candidates who use Twitter receive more votes and that using Twitter interactively yields even more votes. -
5 Conclusion
In this article, we have taken stock of research on preference voting in Belgium and the Netherlands. Preference voting is an important feature of the flexible list-PR system that is used in both countries. Notwithstanding these similarities, both countries also differ, most prominently in the delineation of the concept of preference voting. Whereas in the Netherlands, a preference vote is a vote for another candidate than the list puller, in Belgium, this is defined as a vote for one or more candidates (instead of a list vote). Studies on preference voting in the Netherlands are less numerous than studies on Belgium, and there is also a clear imbalance in the focus of the studies: more studies on candidates at the expense of studies on voters.
Additionally, we see four lacunas that could be filled by future research. First, future research could further explore possible intersectional effects of socio-demographic group memberships. How about the preference votes for, e.g., young female candidates or Muslims with a migration background? Secondly, up to now the supply and demand studies have been conducted completely separately. Future research can invest more efforts into integrating both approaches. This new methodological approach could yield new interesting insights. Van Erkel (2019) has taken the first step in this regard. In a recent study he combines voter and candidate data in a stacked dataset. This approach enables better modelling of the decision-making process of voters, giving a better insight into why citizens cast a preference vote for some candidates and not for others. Moreover, it makes it possible to investigate whether some factors matter more to certain groups of voters, an aspect on which we still lack insight. Thirdly, even though parties usually offer a clear ideological platform, we know from previous literature that they are not always ideologically homogeneous (Andeweg & Thomassen, 2011; Sartori, 1976). Consequently, it could be that voters are guided by ideology not only in their choice of a party, but also in deciding which candidates to support. However, no study has investigated the role of ideology in preference voting yet. Nevertheless, based on first evidence of the PhD theses of van Erkel (2017) and Nagtzaam (2019), it seems that we should not overestimate this effect owing to the fact that ideological positioning of candidates within a party is cognitively demanding and that not much information is available. Fourthly, as mentioned earlier, it is surprising that only a few studies have investigated the effect of social media use on obtaining preference votes (and that it has been done only in the Netherlands) (Kruikemeier, 2014; Spierings & Jacobs, 2014). Given the increased use and importance of social media (also among politicians) and the diversity of available options (one-way communication or interaction, to one person or to many people, etc), more (refined) research on the effects of social media use on preference votes is needed (especially in Belgium). Finally, we found only one study that tested personality factors. Given that journalists often make personality-related claims, future research could explore the strength of this type of psychological factors. References Agentschap Binnenlands Bestuur. (2019). Cijfer in de kijker. Lokale verkiezingen 14 oktober 2018. Brussel: Vlaamse overheid.
Andeweg, R. B. & Thomassen, J. (2011). Pathways to party unity: Sanctions, loyalty, homogeneity and division of labour in the Dutch parliament. Party Politics, 17(5), 655-672.
André, A. & Depauw, S. (2017). Too much choice, too little impact: A multilevel analysis of the contextual determinants of preference voting. West European Politics, 40(3), 598-620. doi:10.1080/01402382.2016.1271596.
André, A., Depauw, S. & Pilet, J.-B. (2017). The nature of preference voting: Disentangling the party and personal components of candidate choice. In K. Deschouwer (Ed.), Mind the gap. Political participation and representation in Belgium (pp. 251-274). London: Rowman & Littlefield.
André, A., Depauw, S., Shugart, M. S. & Chytilek, R. (2017). Party nomination strategies in flexible-list systems: Do preference votes matter? Party Politics, 23(5), 589-600. doi:10.1177/1354068815610974.
André, A., Pilet, J.-B., Depauw, S. & Van Aelst, P. (2013). De partij, de leider of een’gewone’kandidaat? Het gebruik van de voorkeurstem bij de gemeenteraadsverkiezingen van 2012. In R. Dassonneville, M. Hooghe, S. Marien & J.-B. Pilet (Eds.), De lokale kiezer: het kiesgedrag bij de Belgische gemeenteraadsverkiezingen van oktober 2012 (pp. 119-142). Brussel: ASP.
André, A., Wauters, B. & Pilet, J.-B. (2012). It’s not only about lists: Explaining preference voting in Belgium. Journal of Elections, Public Opinion & Parties, 22(3), 293-313.
Balmas, M., Rahat, G., Sheafer, T. & Shenhav, S. R. (2014). Two routes to personalized politics: Centralized and decentralized personalization. Party Politics, 20(1), 37-51. doi:10.1177/1354068811436037.
Bergh, J. & Bjørklund, T. (2011). The revival of group voting: Explaining the voting preferences of immigrants in Norway. Political Studies, 59(2), 308-327.
Bouteca, N., Smulders, J., Maddens, B., Devos, C. & Wauters, B. (2019). ‘A Fair Day’s Wage for a Fair Day’s Work’? Exploring the connection between the parliamentary work of MPs and their electoral support. The Journal of Legislative Studies, 25(1), 44-65.
Bräuninger, T., Brunner, M. & Däubler, T. (2012). Personal vote-seeking in flexible list systems: How electoral incentives shape Belgian MPs’ bill initiation behaviour. European Journal of Political Research, 51(5), 607-645.
Carey, J. M. & Shugart, M. S. (1995). Incentives to cultivate a personal vote: A rank ordering of electoral formulas. Electoral Studies, 14(4), 417-439.
Crisp, B. F., Olivella, S., Malecki, M. & Sher, M. (2013). Vote-earning strategies in flexible list systems: Seats at the price of unity. Electoral Studies, 32(4), 658-669.
Cross, W. P., Katz, R. S. & Pruysers, S. (2018). The personalization of democratic politics and the challenge for political parties. Lanham, MD: Rowman & Littlefield.
Devroe, R. & Wauters, B. (2018). Does high on the ballot means highly competent? Explaining the ballot position effect in list-PR systems. Acta Politica. doi:10.1057/s41269-018-0124-y.
Dewachter, W. (1967). Over het rekenen met de voorkeurstemmen in de wetgevende verkiezingen. RES PUBLICA, 9(3), 205-217.
De Winter, L. & Baudewyns, P. (2015). Candidate centred campaigning in a party centred context: The case of Belgium. Electoral Studies, 39, 295-305. doi: https://doi.org/10.1016/j.electstud.2014.04.006.
Erzeel, S. & Caluwaerts, D. (2015). Is it gender, ideology or resources? Individual-level determinants of preferential voting for male or female candidates. Journal of Elections, Public Opinion and Parties, 25(3), 265-283. doi:10.1080/17457289.2015.1008495.
Folke, O., Persson, T. & Rickne, J. (2016). The primary effect: Preference votes and political promotions. American Political Science Review, 110(3), 559-578. doi:10.1017/S0003055416000241.
Geys, B. & Heyndels, B. (2003). Influence of ‘cognitive sophistication’on ballot layout effects. Acta Politica, 38(4), 295-311.
Holli, A. M. & Wass, H. (2010). Gender-based voting in the parliamentary elections of 2007 in Finland. European Journal of Political Research, 49(5), 598-630. doi:10.1111/j.1475-6765.2009.01910.x.
Hopmann, D. N., Vliegenthart, R., De Vreese, C. & Albæk, E. (2010). Effects of election news coverage: How visibility and tone influence party choice. Political Communication, 27(4), 389-405.
Jacobs, D., Kelbel, C. & Pilet, J.-B. (2013). De politieke voorkeur van kiezers van allochtone afkomst tijdens de gemeenteraadsverkiezingen van oktober 2012 in Brussel. In R. Dassonneville, M. Hooghe, S. Marien & J.-B. Pilet (Eds.), De lokale kiezer. Het kiesgedrag bij de Belgische gemeenteraadsverkiezingen van oktober 2012 (pp. 171-197). Brussel: ASP.
Joly, J., Soroka, S. & Loewen, P. (2019). Nice guys finish last: Personality and political success. Acta Politica, 54(4), 667-683. doi:10.1057/s41269-018-0095-z.
Karvonen, L. (2010). The personalisation of politics: A study of parliamentary democracies. Colchester: ECPR Press.
Kruikemeier, S. (2014). How political candidates use Twitter and the impact on votes. Computers in Human Behavior, 34, 131-139. doi:10.1016/j.chb.2014.01.025.
Lindqvist, J. (2018). Personalization and elitization – preference voting in the Netherlands. ECPR Joint Sessions, Nicosia.
Maddens, B. & Put, G.-J. (2013). Office effects and campaign spending in a semi-open list PR system: The Belgian/Flemish federal and regional elections 1999–2010. Electoral Studies, 32(4), 852-863. doi:10.1016/j.electstud.2013.02.008.
Maddens, B., Wauters, B., Noppe, J. & Fiers, S. (2006). Effects of campaign spending in an open list PR system: The 2003 legislative elections in Flanders/Belgium. West European Politics, 29(1), 161-168. doi:10.1080/01402380500389398.
Marien, S., Schouteden, A. & Wauters, B. (2016). Voting for women in Belgium’s flexible list system. Politics & Gender, 13(2), 305-335. doi:10.1017/S1743923X16000404.
Nagtzaam, M. A. M. (2019). Second-order electoral personalization. Intra-party preference voting in Belgium and the Netherlands. Doctoral thesis. Leiden University.
Nagtzaam, M. A. M. & Van Erkel, P. F. A. (2017). Preference votes without preference? Institutional effects on preference voting: An experiment. Journal of Elections, Public Opinion and Parties, 27(2), 172-191.
Put, G.-J. & Maddens, B. (2013). The selection of candidates for eligible positions on PR lists: The Belgian/Flemish federal elections 1999–2010. Journal of Elections, Public Opinion and Parties, 23(1), 49-65. doi:10.1080/17457289.2012.743465.
Put, G.-J. & Maddens, B. (2015). The effect of municipality size and local office on the electoral success of Belgian/Flemish election candidates: A multilevel analysis. Government and Opposition, 50(4), 607-628. doi:10.1017/gov.2014.36.
Put, G.-J., Maddens, B. & Smulders, J. (2015). Buying local votes: The effect of individual campaign spending under a semi-open pr system in the Belgian local elections. Local Government Studies, 41(1), 137-155.
Put, G.-J., Smulders, J. & Maddens, B. (2014). Een analyse van het profiel van de Vlaamse verkozenen bij de Kamerverkiezingen van 1987 tot en met 2014. Leuven: KU Leuven.
Reilly, B., Ellis, A. & Reynolds, A. (2005). Electoral system design: The new international IDEA handbook. Stockholm: International Institute for Democracy and Electoral Assistance.
Sartori, G. (1976). Parties and party systems. A framework for analysis. Cambridge: Cambridge University Press.
Spierings, N. & Jacobs, K. (2014). Getting personal? The impact of social media on preferential voting. Political Behavior, 36(1), 215-234.
Teney, C., Jacobs, D., Rea, A. & Delwit, P. (2010). Ethnic voting in Brussels: Voting patterns among ethnic minorities in Brussels (Belgium) during the 2006 local elections. Acta Politica, 45(3), 273-297.
Thijssen, P. (2013). Are parties stimulating candidate-centred voting? The case of the Belgian district council elections 2000–2006. Acta Politica, 48(2), 144-166.
Thijssen, P. & Jacobs, K. (2004). Determinanten van voorkeurstemproporties bij (sub-) lokale verkiezingen. De Antwerpse districtsraadsverkiezingen van 8 oktober 2000. Res Publica, 46(4), 460-485.
Thijssen, P., Wauters, B. & Van Erkel, P. (2018). Preferential voting in local versus national elections: The role of proximity revisited. In K. Deschouwer (Ed.), Mind the gap. Political participation and representation in Belgium (pp. 275-294). London: Rowman & Littlefield.
Van Aelst, P., Maddens, B., Noppe, J. & Fiers, S. (2006). Van de studio naar de Kamer? Over de relatie tussen media en voorkeurstemmen bij de verkiezingen van 2003. In S. Fiers & H. Reynaert (Eds.), Wie zetelt? De gekozen elite in Vlaanderen doorgelicht (pp. 163-176). Leuven: Lannoocampus.
Van de Voorde, N. (2019). Does multiple office-holding generate an electoral bonus? Evidence from Belgian national and local elections. West European Politics, 42(1), 133-155.
van Erkel, P. F. A. (2017). Preferential votes: explaining individual electoral success in intra-party competition. Doctoral thesis. University of Antwerp.
van Erkel, P. F. A. (2019). Sharing is caring: The role of voter-candidate similarities in intra-party electoral competition. European Political Science Review, 11(1), 75-89. doi:10.1017/S175577391800022X.
van Erkel, P. F. A. & Thijssen, P. (2016). The first one wins: Distilling the primacy effect. Electoral Studies, 44, 245-254.
van Erkel, P. F. A., Thijssen, P. & Van Aelst, P. (2017). One for all or all for one: The electoral effects of personalized campaign strategies. Acta Politica, 52(3), 384-405. doi:10.1057/s41269-016-0034-9.
van Erkel, P. F. A., Van Aelst, P. & Thijssen, P. (2018). Does media attention lead to personal electoral success? Differences in long and short campaign media effects for top and ordinary political candidates. Acta Politica, 1-19. doi.org/10.1057/s41269-018-0109-x
Van Holsteyn, J. & Andeweg, R. (2012). Tweede orde personalisering: voorkeurstemmen in Nederland. Res Publica, 54(2), 163-191.
Van Holsteyn, J. J. M. & Andeweg, R. B. (2010). Demoted leaders and exiled candidates: Disentangling party and person in the voter’s mind. Electoral Studies, 29(4), 628-635.
Wauters, B. (2000). De kracht van de voorkeurstem in stad en dorp. Leuven: Afdeling Politologie.
Wauters, B., Maddens, B. & Put, G.-J. (2014). It takes time: The long-term effects of gender quota. Representation, 50(2), 143-159.
Wauters, B., Pittoors, G. & Moens, P. (2019). Het gebruik van de voorkeurstem bij de parlementsverkiezingen van 26 mei 2019. Ghent: GASPAR.
Wauters, B., Thijssen, P., Van Aelst, P. & Pilet, J.-B. (2018). Centralized personalization at the expense of decentralized personalization. The decline of preferential voting in Belgium (2003-2014). Party Politics, 24(5), 511-523. doi:10.1177/1354068816678882.
Wauters, B., Verlet, D. & Ackaert, J. (2012). Giving more weight to preferential votes: Welcome or superfluous reform? The case of the local elections in flanders (Belgium). Local Government Studies, 38(1), 91-111. doi:10.1080/03003930.2011.629193.
Wauters, B. & Weekers, K. (2008). Het gebruik van de voorkeurstem bij de federale parlementsverkiezingen van 10 juni 2007. Res Publica, 50(2), 49-88.
Wauters, B., Weekers, K. & Maddens, B. (2010). Explaining the number of preferential votes for women in an open-list PR system: An investigation of the 2003 federal elections in Flanders (Belgium). Acta Politica, 45(4), 468-490. doi:10.1057/ap.2010.6.
Zittel, T. & Gschwend, T. (2008). Individualised constituency campaigns in mixed-member electoral systems: Candidates in the 2005 German elections. West European Politics, 31(5), 978-1003.
Politics of the Low Countries |
|
| Literature Review | Preference Voting in the Low CountriesA Research Overview |
| Trefwoorden | elections, electoral systems, preference voting, candidates, personalization |
| Auteurs | Bram Wauters, Peter Thijssen en Patrick Van Erkel |
| DOI | 10.5553/PLC/258999292020002001004 |
|
Toon PDF Toon volledige grootte Samenvatting Auteursinformatie Statistiek Citeerwijze |
| Dit artikel is keer geraadpleegd. |
| Dit artikel is 0 keer gedownload. |
Bram Wauters, Peter Thijssen en Patrick Van Erkel, "Preference Voting in the Low Countries", Politics of the Low Countries, 1, (2020):77-106
|
Preference votes constitute one of the key features of (open and flexible) PR-list electoral systems. In this article, we give an extensive overview of studies conducted on preference voting in Belgium and the Netherlands. After elaborating on the definition and delineation of preference voting, we scrutinize studies about which voters cast preference votes (demand side) and about which candidates obtain preference votes (supply side). For each of these aspects, both theoretical approaches and empirical results are discussed and compared. At the same time, we also pay attention to methodological issues in these kinds of studies. As such, this research overview reads as an ideal introduction to this topic which has repercussions on many other subfields of political science. |