

-
1 Introduction
In recent years, political science research has devoted extensive attention to voter turnout. However, only a few studies have focused on those voters who go to the polling station to cast an invalid vote (i.e., blank and null votes). This group of voters is relevant in the study of any democracy, but they are all the more relevant in Belgium where voting is compulsory. In such contexts, invalid votes allow us to better understand the electorate’s behaviour. First, we explore in detail the nature of invalid votes. Do we observe that null ballots are deliberate and that voters meant to spoil their ballot? Or do we observe that ballots have been invalidated because of a mistake by the voter? If it is the latter, how many invalid votes are intentional and how many are unintentional? Second, it allows us to study the factors influencing the share of blank and null votes. By analysing the share of null and blank votes across municipalities, we consider possibilities as to where such votes are more frequent and how the local political context may influence the quantity of such ballots. These elements would directly contribute to enriching the literature beyond the mere dichotomy between voters and abstainers.
The study of blank and null votes contributes to current political debates about democracy. It allows us to look at whether the complexity of the party system has an impact on the number of invalid votes, or whether the municipality’s socio-economic context matters. It could also lead to the reopening of the debate on how best to inform voters so that they better understand the rules of the electoral system, in other words, how to cast a ballot. Another important contribution of this article relates to the ongoing debate that opposes those who defend electronic voting to those who prefer paper voting in Belgium. Whereas the Flanders and Brussels regions apply electronic voting, Wallonia has fully shifted back to paper ballots. Our analyses thus contribute to the discussion of how these changes may have an impact on the quantity and types of invalid ballots cast.
The article is divided into six sections. In the first, we present a review of the academic literature on blank and null ballots. The second section presents our research objectives. In the third, we detail the data on which our analysis is based. We then describe the evolution of null and blank voting in Belgium over time. In the fifth section, we decompose invalid ballots into null, blank, intentional null and unintentional null votes. Finally, in the last section, we try to analyse differences observed across municipalities of the share of intentional and unintentional null ballots to isolate some elements of the political and socio-demographic context that may have an influence on these two types of invalid votes. -
2 State of the Art
The academic literature devoted to the understanding of blank and null votes is quite limited. It mostly covers countries where voting is compulsory (Belgium, Brazil, Australia, Bolivia). Two main lessons can be derived from this literature review. First, previous studies have almost always studied blank and null votes conjointly. The main reason for that has been the lack of data. Official results rarely distinguish between these two types of votes, which makes it difficult – and in some cases, impossible – to analyse null votes separately. Second, at the time of writing, few studies attempted to differentiate among types of spoiled ballots. Only a few publications have distinguished between the two types of invalid votes and tried to contrast their main drivers (Pachon, Caroll, & Barragan, 2017; Stiefbold, 1965). Thus, we know little about how many are unintended errors or how many ballots are deliberately nullified. We begin with the findings from the comparative literature, and then go into more detail by discussing previous studies on the Belgian case.
The first main finding from the comparative literature is that blank and null votes may emanate from a very different logic, including protest, ignorance, apathy or errors. Particularly, Driscoll and Nelson (2014) have shown that in Bolivia, blank and null ballots are the expression of a voter’s critique of democracy, or their opposition to the ruling authorities. Yet, one main difference seems to emerge – unintentionally invalidated ballots (whether blank ballots or intentionally spoiled ballots) and ballots that are invalidated by authorities due to voter error.
In addition to decomposing blank and null ballots, scholars have also tried identifying factors that could explain the share of invalid ballots observed in various contexts, mostly by building on the literature on abstentionism. This literature on turnout has isolated several factors that could help understand why some citizens vote while others do not (Blais, 2006; Braconnier, 2016). A first set of explanations has focused on the individual level. First, socio-demographic factors such as education, age or socio-economic conditions are central in differentiating voters and non-voters. In addition, political factors like political interest and partisanship are also crucial. Apart from individual factors, contextual variables are also central in accounting for variations in turnout. Three main sets of factors have been identified at this level: institutions (compulsory voting, electoral system, voting regulations, unicameralism, types of government), the political context (number of parties, closeness of the election) and the socio-economic environment (economic wealth, urbanization).
First, institutions have been shown to play a role. These include the laws that frame elections such as mandatory voting, voting system (proportional or majoritarian), electronic voting and district size. Of these, two elements stand out in affecting blank and null votes. The first is compulsory voting. Scholars tend to agree that there is a positive link between mandatory voting and the rate of blank and null ballots (Blais, 2006; Kouba & Lysek, 2015; Percheron, Subileau, & Toinet, 1987; Power & Roberts, 1995; Power & Garand, 2006; Stiefbold, 1965; Uggla, 2008).
The second element is electronic voting. Electronic voting does not allow voters to cast null votes. The argument is that electronic voting made voting easier and prevented unintentionally nullified votes. For example, using experimental methods in the Brazilian context, Nicolau (2015) showed that the introduction of electronic voting machines greatly reduced the quantity of null votes in elections. Clearly, the voting method (electronic or paper) has consequences on both null and blank ballots.
Finally, some authors have insisted that all institutional rules facilitating the act of voting have to be taken into consideration in accounting for the share of null and blank votes. In Australia, for example, McAllister and Makkai (1993) showed that the complexity of a ballot and limited knowledge of a country’s language in immigrant communities could explain spoiled ballots. Similarly, Pachon et al. (2017) found that simplifying the ballot design significantly reduced the level of invalid voting in Colombia. Furthermore, Blais (2006) argues that voting on Sundays or presenting alternative modes of voting (postal, paper or electronic) makes voting easier and has a positive effect on turnout.
The political context has been underlined as a crucial factor affecting blank and null ballots. There are two conflicting views. On the one hand, null and blank ballots are more frequent when voters have difficulty finding a party or a candidate that aligns with their political views. Consequently, null and blank votes will be less frequent when the number of parties on the ballot increases, thereby providing a wider choice to voters (Aldashev & Mastrobuoni, 2019). Similarly, some studies have shown that the absence of radical parties that would capture protest votes may lead dissatisfied voters to instead vote blank or nullify their vote (Driscoll & Nelson, 2014; Stiefbold, 1965).
The opposite view is that voters will cast a blank or null vote when they are faced with cross pressures or if the election is too close to call. It would be the case when there are too many parties (McAllister & Makkai, 1993; Power & Roberts, 1995) but also when the elections would lead to no clear winner, and that a coalition of parties would eventually have to be constituted to form a government. Second, when it comes to the political context, studies have also shown that, like for abstention (Blais, 2006), the closeness of electoral races has an influence on null and blank votes. We find an increase of such votes when the margin of victory of the winning party/candidate is higher (Uggla, 2008). It could be explained by the fact that voters perceive their vote to be less decisive, consequently that they have less to lose. In such a context, citizens are less motivated to vote and may more often opt for a blank or null vote (Kouba & Lysek, 2015; Percheron et al., 1987).
The third set of factors affecting blank and null ballots are the socio-economic and socio-demographic contexts. According to Nicolau (2015) 50% of null and blank ballots can be explained by socio-economic factors. Null and blank ballots are more frequent in less affluent areas and in times of economic recession (see also Driscoll & Nelson, 2014; Percheron et al., 1987; Stiefbold, 1965). Nonetheless, some authors claim that socio-economic factors were less crucial than political and institutional elements (Kouba & Lysek, 2015; Uggla, 2008).
Education is also associated with an increase of null and blank ballots, both studied as an individual-level and a contextual-level variable (Aldashev & Mastrobuoni, 2019; Blais, 2006; Driscoll & Nelson, 2014; Zulfikarpasic, 2001); nonetheless, a few studies have more nuanced arguments than others (Pachon et al., 2017; Power & Roberts, 1995; Uggla, 2008). Their argument is that less educated voters would find it more complicated to understand politics, and particularly electoral rules. The same argument is applied to first-time voters who are also more likely to contribute to the increase of null or blank ballots (Blais, 2006; Percheron et al., 1987; Power & Roberts, 1995; Stiefbold, 1965; Zulfikarpasic, 2001).
Finally, a few other studies have underlined the differences between rural and urban areas in the share of registered blank and null ballots. A greater share of such votes seems to be found in urban areas. This can either be explained by more social control in rural contexts, which leads to pressure to not voluntarily cast a blank or null vote, or by a culture of higher political protest in urban areas (Zulfikarpasic, 2001, p. 267).
In addition to the comparative literature, it is crucial to describe what political science research has so far told us about blank and null votes in the Belgian context. The most comprehensive study in that respect is the one published by Pion in 2010. A few years ago, he obtained access to 2,000 invalid ballots from six voting districts from the 2009 regional and European elections. Using this data, he has been able to single out a few factors that seem to account for variations in the share of blank and null votes across the six districts. First, he showed that electronic voting had an impact on reducing blank and null votes. Second, it appears that there were more null and blank votes in the less well-off areas. Third, there were more null and blank votes in more urbanized areas.
In addition to these elements, underlined by G. Pion, other studies provide insight on null and blank ballots in Belgium. In particular, the impact of compulsory voting in increasing blank and null votes is confirmed (Billiet, 2001). Mandatory voting in Belgium creates two latent triggers for null and blank votes. Firstly, it increases the votes of citizens who would not otherwise vote if voting was not mandatory (De Winter & Ackaert, 1994). Indeed, it can be the case for voters who otherwise feel like political outcasts (De Winter & Ackaert, 1994).
The role of electronic voting has also been stressed. Yet, some scholars argue that it could boost rather than reduce null, and especially blank votes, at least in the way in which elections are organized in Belgium. On the computer screen, voters see all available options for a valid vote. All parties running are listed, and there is also a box for a blank vote. This could give more voters the impression that blank voting is as legitimate as voting for a party (Wauters, Verlet, & Ackaert, 2012). The impact of the structure of political competition has also been underlined. In particular, certain studies have shown that the absence of radical parties that could capture protest votes may lead dissatisfied voters to instead opt for voting blank or to nullify their vote (De Winter & Ackaert, 1994; Hooghe, Marien, & Pauwels, 2011). Finally, the impact of education and of lower socio-economic conditions on boosting null and blank votes was also isolated (Billiet, 2001; De Winter & Ackaert, 1994). -
3 Research Objectives
In light of the literature review, this article focuses on three main research objectives. The first research goal is to provide a detailed account of the nature of null and blank votes in Belgium. While voters opting for these options are a minority (6.7% of blank and null votes in Wallonia in 2018), they are significant and cannot be ignored. Previous scholarship is mostly based on official results that do not differentiate between the two types of ballots. To our knowledge, a relatively limited number of researchers (De Maesschalck, 2018; Driscoll & Nelson, 2014; Pion, 2010) have taken it one step further by trying to categorize the different types of invalid votes. In that respect, blank voting is clearly defined: it is a ballot not marked with any choice for a list or a candidate. The literature suggests that blank votes are associated with a signal protestation vis-à-vis the party offer or lack of interest in politics, or they may be driven by individual characteristics such as education level. Null ballots remain, however, a relative black box. Following this line of research, we argue that not all null ballots are voting mistakes. On the one hand, null votes can be an intentional refusal to cast a valid vote – for example, via a message written on the ballot or a small drawing. From that perspective, we argue that those votes are ontologically similar to blank votes; they represent a way for voters to show their discontent and dissatisfaction with the electoral offer, the system or political actors. On the other hand, null ballots can be unintentionally null votes as voters wrongly express their preference. In Belgium, a vote can be declared null because the ballot is marked with preferences for several lists (i.e., panachage) or because voters marked their ballots with non-valid signs (e.g., by drawing a cross instead of filling in the circle next to the name of a candidate or a list; using their own pencil instead of the mandatory red pen of provided at the polling booth).
The share of unintentional null votes is very sensitive to how strict election officials are when counting the votes. Some officials may be very strict and would invalidate any ballot not complying with the official guidelines. Other officials would be less strict and would leave more room for interpretation in deciding which ballots are valid and which are not. As we will describe below, our analyses have, for example, shown that in some cases, ballots were declared valid although the voter had circled the name of the preferred candidate, instead of filling in the box next to his/her name as required. Yet the extent of empirical knowledge on intentional and unintentional null ballots is virtually unknown because of a lack of data. We will try and open this black box.
We argue that this distinction matters for us to understand the electoral behaviour of voters whose choices are not translated into seats in elected assemblies. A better understanding of “protest votes” (blank and intentional null votes) allows us to understand the conditions under which voters decide to – in Hirschman’s words – “exit” the parties’ offers at elections. Furthermore, it is paramount to identify the determining factors in unintentional null votes, which represent mere electoral errors, otherwise thousands of valid electoral votes will not be accounted for.
The second research objective is to try and analyse the factors that could help understand the share of protest and error votes observed. The review of the literature in Section 2 has underlined individual- and contextual-level factors. In our study, we have no access to individual-level data, but we can examine the impact of contextual-level factors across these 49 municipalities. The underlying goal is to understand whether protest and error votes are explained by factors other than abstention, or whether they are two sides of the same coin.
Finally, we stress that our analysis of the 2018 Walloon local elections is also unique because they were held just one year after Wallonia decided to abandon electronic voting for local elections (ballot papers being the only method used). In 2012, 39 out of 262 Walloon municipalities used electronic voting while the remaining municipalities used paper ballots. It stands in clear contrast with Flanders, where about half of the municipalities voted electronically in the 2018 local elections, and with Brussels, where electronic voting is used in every municipality. As underlined above, the choice between paper and electronic voting is a loaded decision when it comes to blank and null votes. On the one hand, electronic voting does not allow voters to cast null votes. The software would not allow invalid votes. On the other hand, electronic voting could also legitimize blank votes. We thus explore how the choice of the Walloon government to go back to paper ballots influenced the rate of null and blank votes in the recent local elections. -
4 Data
Our article is based upon a study of local elections in Wallonia. The choice of this region is justified by three factors. The first is that Wallonia is an interesting case because voting in elections is compulsory. The issue at hand in most democracies would be abstention, while here we have a case where abstention is, for legal reasons, quite low. Yet it does not mean that all voters take part in the electoral process. A few of them abstain (see Section 4) but several of them also cast a blank or a null vote. It could be because invalidating the ballot is the functional equivalent of abstaining. But it could also be because some voters are unfamiliar with the political system. They would abstain in most countries. In Wallonia, they could vote, or they could cast an invalid ballot by mistake. Second, Wallonia is a relevant case because it has recently changed the way votes are cast. Walloon voters used to vote either on computers or on ballot papers. In the recent local elections, Wallonia fully shifted back to paper ballots, which could also have consequences for invalid voting. Finally, there is a purely pragmatic motivation. We have obtained the unique opportunity to observe and code a large sample of invalidated ballots, which allows us to open the black box, to know what actually constitutes an invalid vote.
In the elections, once Belgian public authorities have counted all votes, official results are published. One of these results is the share of null and blank votes, which are counted together in the official results. We have virtually no empirical data on the respective share of blank and null ballots, nor do we know how null ballots have been invalidated by voters. Thanks to a collaboration with the Walloon administration, we were granted access to a sample of ballots from the local elections (for a period of two months following the election until the final destruction of the ballots as required by the Walloon electoral legislation).
It was materially impossible to observe and re-code all ballots in all municipalities. We therefore opted for a sample of municipalities, then a sample of ballots within each of these municipalities. The sampling procedure had four steps. First, from the 262 municipalities we created a representative sample of 49 Walloon municipalities using two main criteria (see Appendix A.1: provinces, degree of urbanization based on Eurostat classification while checking for a diversity of local party systems). With this sample of 49 municipalities, we were able to include the diverse socio-demographic and socio-economic contexts, and political variations across Walloon municipalities. Secondly, for each municipality, we randomly drew a number of vote-counting stations. Vote-counting stations are the bureaus where electoral votes from three polling stations are stored, organized and counted. In each municipality, the number of vote-counting stations selected varied from two to nine, depending on the population size of a municipality. We selected between two and five per municipality in order to avoid concentrating the analyses on a limited area within each municipality. Thirdly, we randomly selected large bags in which ballot papers are stored. On average, there are two to five bags per counting stations, from which we randomly selected between one and three bags. Within those bags, ballot papers are stored in envelopes. The content of an envelope of valid ballots is determined by the list that obtained the vote and then divided as such within the large bag. There was also one envelope for the blank and null votes. We opened the latter envelope and separately counted blank and null votes. Finally, the last step of the sampling procedure was to randomly draw a sample of null votes within each bag opened. In total, we drew 6,453 null votes. The goal was to start with a minimum number of 60 null ballots in the smallest municipality, and then to increase that number for more populated municipalities. The two guiding principles were to have enough ballots in each municipality to run robust statistical analyses, and to have a sample that is not overall distorted in favour of the smallest municipalities. Each of the selected ballots was then coded to determine why the ballot had been declared null.
In total, we have two levels of data for each of the 49 municipalities covered. First, we have the respective share of null and blank ballots on the basis of a total of 13,243 invalid ballots. Second, from these 13,243 invalid ballots, we left out all blank ballots and have constituted a sample of 6,453 null ballots. For these 6,453 null ballots, we can differentiate between intentional and unintentional null votes. -
5 Null and Blank Ballots in Wallonia and Other Belgian Regions
Before going into our data, we first discuss the representative weight of null and blank ballots in elections in Wallonia, and more broadly across Belgium. Table 1 shows the evolution of invalid votes (share of null and blank ballots) for legislative elections between 1946 (first elections after World War II) and 2014.
Table 1 also shows the evolution of invalid votes in Wallonia for local elections between 1976 and 2018. Indeed, during the 1970s, the number of municipalities was reduced from 2359 to 596, and later on to 581. Today, the Walloon region is composed of 262 local municipalities, the Flemish region is composed of 300 municipalities and the Brussels region is composed of 19 municipalities.Table 1 Evolution of blank and null ballots (invalid ballots) in Belgian national and local elections (1946-2018)Year of legislative election % of invalid ballots Year of local election % of invalid ballots (Belgium) % of invalid ballots (Flanders) % of invalid ballots (Wallonia) % of invalid ballots (Brussels) 1946 3.9 1949 5.4 1950 5.3 1954 5.5 1958 n.a. 1961 5.5 1965 7.1 1968 6.8 1971 8.0 1974 7.9 1976 3.0 3.0 2.8 4.0 1977 7.2 1978 8.4 1981 7.3 1982 4.2 4.1 4.3 5.4 1985 7.4 1987 6.6 1988 4.4 3.9 4.8 5.4 1991 7.0 1994 4.9 4.5 5.5 4.4 1995 7.5 1999 6.6 2000 5.2 4.1 6.5 4.9 2003 5.3 2006 4.9 3.9 6.1 5.1 2007 5.1 2010 5.8 2012 5.0 3.5 6.7 5.6 2014 5.8 2018 5.4 4.1 6.8 6.0 MEAN 6.44 MEAN 4.61 3.9 5.44 5.11 The table shows that the average percentage of invalid ballots is around 6.4% in legislative elections and around 4.88% for the local elections. Furthermore, the ratio of invalid votes for local elections oscillates between 4.4% and 5.2% at the national level and between 4.8% and 6.7% in Wallonia. The portion of invalid votes is significantly lower in Flanders where it varies between 3% and 4.5%. For legislative elections, invalid voting shows higher values ranging between 5.1% and 8.4% in Belgium. Thus, it seems that there is no specific or significant trend in relation to the share of invalid votes at the federal or local level, except for a slight increase of invalid votes in local elections since 1988 in Wallonia.
-
6 Decomposing Blank and Null Votes of the 2018 Walloon Local Election
From a descriptive stance, the data we have collected already greatly advances what we know about null and blank ballots in Belgian elections. As explained above, we have only found one study that was able to distinguish between the two types of invalid ballots. A few years ago, Geoffrey Pion (2010) had access to 2,000 invalid ballots from six voting districts on the occasion of the 2009 regional and European elections. He showed that about one-third were blank ballots, and two-thirds were null ballots. He was also able to separate null ballots between errors, ballots marked with a message, a sign or a drawing and ballots marked with a large cross over the ballot meant to invalidate it.
With this article, we are able to consolidate his findings with a representative sample of municipalities, ballots and a more thorough coding scheme. First, we distinguish between blank and null ballots (see Table 2). Our analysis confirms what G. Pion has found – there are more null votes than blank ballots. And we observe the same proportions as Pion did, with one-third of blank ballots and two-thirds of null ballots. However, we also observe variations across municipalities. The share of null ballots ranges from 47.1% in (Chièvres) to 77% (in Fernelmont).
From these figures, we can estimate how many voters have either cast a blank or a null ballot. It is what we see in the last two rows of Table 2. To infer these numbers, we use the official figures of the total share of blank and null ballots in the municipality as a baseline and multiply it by the respective share of blank and null ballots that we observe in our sample. These figures are to be read carefully as they are extrapolations based upon a sample of ballots. Yet, overall, they produce some clear indications that are worth being discussed. On average, 4.4% of all eligible voters cast a null vote while 2.31% cast a blank ballot. Across municipalities, it ranges between 2.02% and 6.75% for null votes among all potential voters, and between 0.97% and 4.45% for blank ballots. Such figures may appear quite small. Nevertheless, reported in terms of the number of actual votes, they are substantial. For a sample 49 municipalities, this represents a total of 34,697 null votes and 18,349 blank ballots.Table 2 Share of blank and null ballots in the sample (in %)Source of data Types of invalid ballots Mean value Standard deviation Minimum value Maximum value Sample data % of null ballots among all invalid ballots 65.4 8.2 47 79.1 % of blank ballots among all invalid ballots 34.5 8.2 20.8 52.9 Official results % of blank and null ballots among all votes 6.7 1.8 3.5 9.8 % of null ballots among all eligible voters 4.4 1.3 2 6.7 Extrapolations on the basis of sample data % of blank ballots among all eligible voters 2.3 0.8 1 2.7 The second main contribution of our study, in descriptive terms, is that we have looked at why a null ballot has been invalidated. As Pascal Delwit (1992, p. 185) underlined some years ago, we can assume that some of the null votes are intentional decisions to spoil a ballot, but another part of null votes may also be errors. These errors may be ballots on which a voter has cast a vote for several lists (or for several candidates on several lists), but also ballots that have not strictly followed the rules on how to cast a valid vote. A valid vote is a vote marked with the red pen made available at the polling station (and not with any other colours or pens). The pen must be used to colour in the small circle positioned next to the name of the candidate or on top of the list (for a list vote). Marking a vote by circling the name of a candidate or of a party list, or even marking a cross in one of the official boxes (instead of colouring it in) formally nullifies the ballot (even if we have observed from the ballots in the sample that some officials in the counting stations do not strictly apply that rule of the electoral legislation).
Using this distinction, we coded the 6,453 null ballots from our sample. We first separated null ballots into two broader categories: intentional null votes in which it is clear that the voter was not willing to cast a valid vote, and unintentional null votes for which it could very well be that the voter has tried to cast a valid vote but has made an error. Within the category of intentional null votes, we have classified ballots as follows: ballots marked with a big cross all over the ballot, ballots marked with votes for multiple lists and candidates1xIn this study, we consider that when a voter cast a vote for more than two lists, it was no longer a mistake but a clear willingness to invalidate the ballot. On the other hand, when a voter only chose two lists, it was assumed to be a mistake. This operationalization does not rely upon previous studies but rather from the observation of our sample. The clear majority of ballots with panachage are either ballots with votes on two lists or with votes on (almost) all lists. Ballots with votes on three lists are marginal., ballots with a message written on them, ballots on which voters have drawn a picture and ballots marked with insults. We argue that in all of these cases, voters were clearly not trying to cast a valid vote. Rather they expressed a willingness not to vote.
On the other hand, among the unintentional null votes, we have ballots for which we believe voters were actually trying to cast a valid vote. Three types of null votes fall within this category. First, there are ballots marked with choices for a few candidates on a few lists. This type of panachage was previously allowed in local Belgian elections until 1976 and is still an option in some list PR systems such as in Luxembourg or Switzerland. Nowadays, they are counted as null votes in Belgium. Second, there are ballots marked with another pen or pencil in a colour other than the mandatory red pen provided in all polling stations. Finally, there are ballots on which the vote is expressed by marking a cross in the voting circle next to the name of each candidate or party list, or by circling or underlining the name of the preferred candidate(s). Those votes are legally declared null votes. Only ballots marked by colouring in red the box next to the name of each candidate or the party list are to be declared valid. Table 3 reports the share of the three types of unintentional null ballots. The first observation is that, on average, there are almost as many intentional votes (56.68%) as unintentional votes (43.13%). Yet, there are important variations across municipalities – the share of intentional null votes ranges between 26.32% and 94.12%.Table 3 Types of null votes (in %)Types of null ballots Mean value Standard deviation Minimum value Maximum value Unintentional null votes Panachage 33.98 14.46 0.00 63.16 Incorrect voting 9.15 7.34 0.00 29.41 Subtotal 43.13 15.28 5.88 73.66 Intentional null votes Large cross 24.40 11.95 5.26 48.94 Vote for all parties/candidates 6.91 9.34 0.00 48.89 Written messages 12.99 6.54 0.00 32.56 Pictures 9.64 3.96 0.00 16.98 Insults 2.73 2.61 0.00 11.36 Subtotal 56.68 15.28 26.32 94.12 Missing Subtotal 0.19 0.39 1.52 0.00 The distribution of intentional and unintentional null votes between the different categories varies greatly. The most frequent are those with a large cross drawn across the entire ballot paper (43.05% of all intentional null votes). The second most frequent category is of ballots invalidated because there was a message on the ballot paper. These messages are of various types – some are negative political claims (e.g., ‘all politicians are liars’) while others ask for changes or new policies in the political system (e.g., ‘more equality for women’, ‘stop immigration’). In third place, drawings represent 9.64% of null ballots; they can be non-political (e.g., hearts, flowers, smileys) as well as political (symbols of anarchy, Nazism, peace and love). Finally, 6.91% of all null ballots are marked with a vote for many lists or candidates. Among the latter, a majority are ballots on which a voter has voted for all candidates on all lists.
With regard to unintentional null votes, the most frequent is panachage. About three-quarters of ballots that we have categorized as unintentional null votes are ballots on which a voter has cast a vote for several lists. And that is excluding those ballots where many candidate lists were voted for. We have kept those ballots with votes on two different lists. Other types of errors (incorrect colour, circling the name of the candidate, crossing the voting box) are much less frequent. Yet, in some municipalities, errors may account for over 20% of all null ballots. It may be due, as we have explained above, to the presence of stricter election officials who did not declare these votes as valid.
Overall, unintentional null votes (errors in voting) represent a large proportion of invalid votes. The analysis presents a more exhaustive picture of electoral behaviour and invalid votes. Protest votes (blank and intentional null votes) and error votes (unintentional null votes) represent respectively 73.9% and 26.1% of all invalid votes. In the 49 municipalities of our sample, unintentional null ballots account for 1.7% of all eligible voters, or 15,292 voters. Based on our sample, we can infer that they represent a total of 44,668 voters in all of the 262 Walloon municipalities (for a total of 2,627,522 eligible voters). Although electronic voting presents its own limitations (lower transparency of the electoral process as well as greater costs), its main advantage is unmistakably to prevent voters from casting unintentional null votes. Indeed, panachage is technically impossible as voters first select a party list – or a blank vote – among all lists in competition, and then, voters cast their vote for the head of the list and/or preference votes. Likewise, the only option available to voters is to tick the box beside the head of the list and/or candidates; it is technically impossible to circle candidates or use different colours as with paper ballots. -
7 Understanding the Differences Between Intentional and Unintentional Invalid Ballots
As shown in the state of the art, one of the central questions when studying blank and null ballots is the difference between ballots that are intentionally invalidated by voters (such as blank ballots and intentional null votes) and those that are invalidated unintentionally (i.e., unintentional null votes). The difference is all the more crucial in the case of the 2018 local elections in Belgium. The Walloon region, unlike Flanders and Brussels, decided to abandon electronic voting. On a computer, only intentional blank votes are possible. The software on which voters cast their vote asks voters to re-vote if they cast a null vote by mistake, thereby eliminating voting errors and preventing intentional null votes.2xUntil the 2014 regional, federal and European elections, null votes were still technically possible under very specific conditions. This is the case for voters who would – voluntarily or involuntarily – damage more than twice the magnetic card provided for the electronic vote. Under such circumstances, the president of the polling station had to cancel the votes (i.e., null votes) while preventing voters from any further attempts to vote.
In this section we compare the respective share of intentional and unintentional invalid ballots across the 49 Walloon municipalities of our sample. Building on the literature on turnout as well as on null and blank ballots, we examine a few factors that may explain differences in the weight of invalid ballots by protest and invalid ballots by error. It is important to bear in mind that we can only test the impact of contextual factors at the municipal level. We did not have access to individual-level data, due to the confidential nature of elections. For this reason, our analysis focuses on municipal-level factors.
Starting with intentional invalid ballots, the academic literature offers two possible explanations. The first is that intentional invalid ballots are a sign of protest by voters who are dissatisfied with the electoral offer. In other words, the voters cannot align with a party, a list or a candidate that meets their aspirations. On that basis, two hypotheses can be formulated. The first is that there will be more intentional invalid ballots when there are fewer parties (Aldashev & Mastrobuoni, 2019), and the second when there are no anti-system parties to capture protest votes (De Winter & Ackaert, 1994; Driscoll & Nelson, 2014; Hooghe et al., 2011; Stiefbold, 1965). In the case of Wallonia, we have considered that the Parti Travailliste de Belgique (PTB) and the Parti Populaire (PP) would be considered as ‘radical/anti-system’ parties for three reasons. First, they are not part of the local coalitions in any of the municipalities studied. Second, they are demonized by the more mainstream political parties. Thirdly, they themselves call for radical transformations of the political system, an element that would qualify them as anti-system according to Capoccia (2002).H1: The higher the number of parties running in the municipality, the fewer intentional invalid votes will be observed.
H2: The higher the number of anti-system parties running in the municipality, the fewer intentional invalid votes will be observed.
The second line of explanation for the share of intentional invalid ballots should be explained by the socio-demographic context. In particular, there would be more of such ballots in municipalities where socio-economic conditions are lower. In areas that are worst off, dissatisfaction with politics tends to be higher and translates into more abstention and increased intentional invalid votes (Nicolau, 2015).
H3: The better the socio-economic conditions in the municipality, the fewer intentional invalid votes will be observed.
With regard to unintentional invalid votes, we also find the same clusters of explanatory contextual factors in the literature – political and socio-demographic. Therefore, ballots invalidated due to errors would be caused by two sets of factors: the complexity of the electoral offer and voters’ political sophistication. For the first aspect, the idea is that a too-broad political offer would confuse voters, increasing the risk of voting errors. Moreover, a growing number of parties would increase the risk of mistakes as the ballot paper becomes more confusing (McAllister & Makkai, 1993; Power & Roberts, 1995). For example, in the municipality of Liège, a voter had a choice between 12 lists, which included a total of 392 names in them. The ballot paper was extremely oversized, increasing the chances for a voter to make a mistake in casting his/her vote. We can therefore formulate the following hypotheses:
H4: The higher the number of parties running in the municipality, the more unintentional invalid votes will be observed.
H5: The higher the number of candidates running in the municipality, the more unintentional invalid votes will be observed.
Lastly, another explanation for unintentional invalid ballots is that some voters would not understand how to cast a valid vote. Unfortunately, as mentioned, we do not have information at the individual level on the educational background of voters who have unintentionally cast an invalid vote. Even at the contextual level, reliable information on the educational background of voters is not always easy to capture. Yet, building on previous research, we can use socio-economic indicators of the municipality as a reliable measure. We might expect more unintentional invalid votes in municipalities with weaker socio-economic conditions (De Winter & Ackaert, 1994; Driscoll & Nellson, 2014; Percheron et al., 1987).
H6: The higher the socio-economic conditions in the municipality, the fewer unintentional invalid votes will be observed.
To test the hypotheses, we examine the respective shares of both intentional and unintentional invalid ballots across the 49 municipalities in our study. The two percentages in each of the municipalities are our two dependent variables. For each hypothesis, we are able to run bivariate analyses. Unfortunately, we cannot run multivariate models given the reduced size of our sample.
With regard to intentional invalid ballots (blank ballots and intentional null votes), the main findings are that the political context hypotheses (H1, number of lists and H2, presence of protest parties) are inferred, while the socio-demographic context hypothesis (H3) is confirmed. Figure 1 presents the share of intentional invalid votes in relation to the number of parties (on the left), and to the presence of one or two protest parties (on the right). Again, H1 is rejected. The share of intentional invalid votes slightly increases when the number of lists on the ballot increases, but the variation is not statistically significant. Secondly, with regard to the presence of protest parties we observe statistically significant variations, but in the opposite direction than hypothesized. The share of intentional invalid votes grows when there are one or two protest parties on the ballot paper. The two types of voting are found in the same municipalities, meaning that these municipalities are fertile grounds for several types of protest votes.Figure 1: Percent of protest votes in a municipality’s electorate according to the number of lists (left) and presence of radical/anti-system parties (right).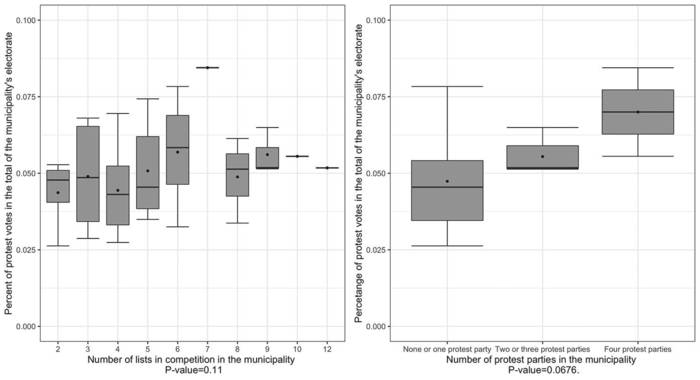
By contrast, H3 which tests the effect of the socio-demographic context of the municipality on intentional invalid votes is confirmed. In order to differentiate across municipalities’ economic context, we use the municipality’s index of income inequality. Among the socio-economic indicators made available by the National Office for Statistics (Statbel), this one presents a relative measurement of income dispersion for the voters of the same municipality. Indexes with relative scores are better suited when comparing effects across municipalities. Other absolute measurements are available (e.g., mean income per municipality) but they compare “apples and oranges” across municipalities (e.g., a given income does not provide the same purchasing power in different municipalities). As it appears in Figure 2, there is a clear positive and statistically significant (p < 0.0001) relationship between the total share of blank and intentional null votes and the municipal index of income inequality.
Figure 2: Percent of protest votes according to a municipality’s socio-economic index of inequality.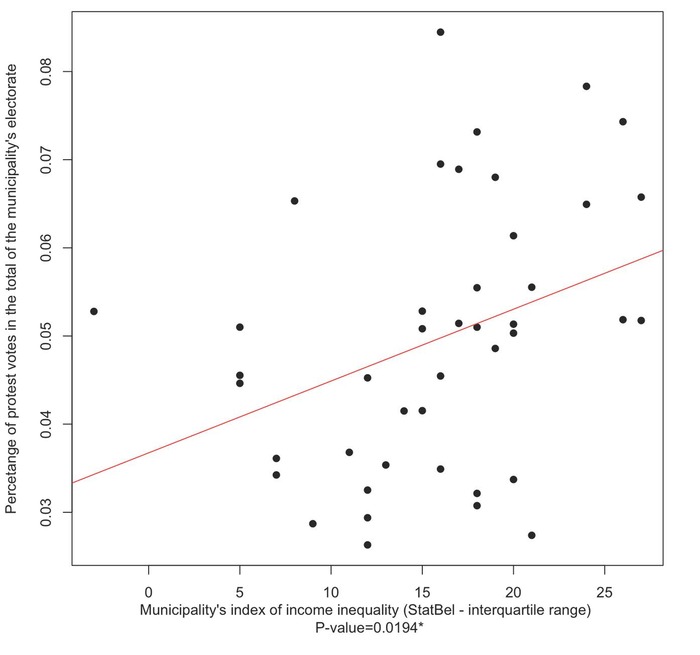
Turning to unintentional invalid votes, or voting errors, the situation is slightly different. Both political and socio-demographic factors appear to have an effect when accounting for this type of invalid ballots. First, as shown in Figure 3, we can see that there is indeed a real increase in the number of unintentional invalid votes in municipalities where the electoral offer is broader. It is true in municipalities where the number of lists on the ballot is higher (H4), but it is even more the case when there are many candidates on the ballot (H5). The effect of this last variable on the percentage of unintentional invalid votes is both statistically significant (p < 0.0001) and substantial in magnitude.
Figure 3A: Percent of error votes in a municipality’s electorate according to the number of lists.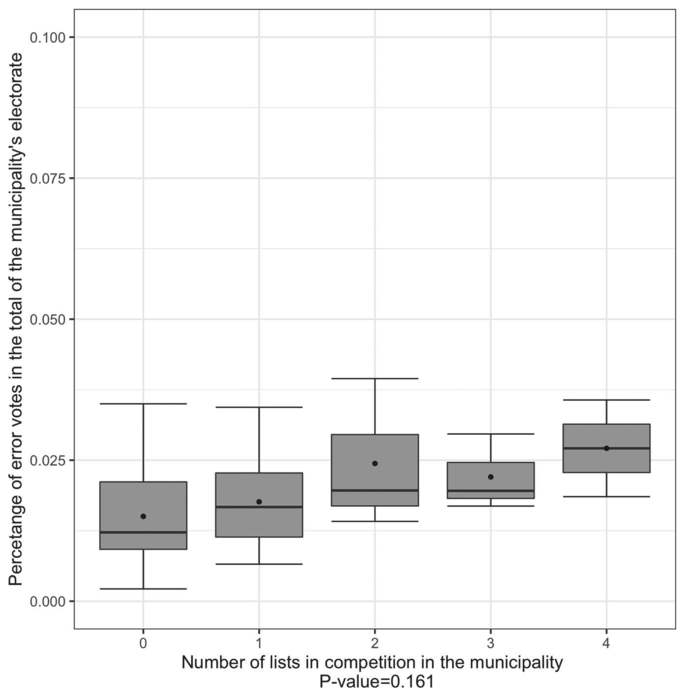 Figure 3B: Percent of error votes in a municipality’s electorate according to the number of candidates present.
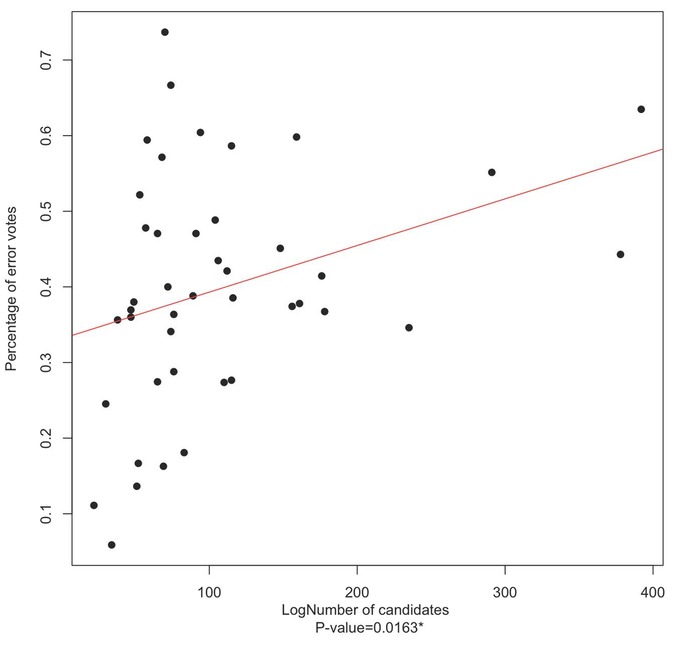
In addition, H6, which measures the impact of socio-economic conditions on unintentional invalid votes, is also validated (see Figure 4). The percentage of eligible voters casting an unintentional invalid vote increases significantly as the index of income inequality of the municipality goes up. Income inequality is not the perfect indicator of voters’ political sophistication, but it is the one that is available to us from official statistics and we know that the two variables tend to be strongly correlated. In other words, it does indicate that there are more unintentional invalid votes in those contexts with more voters who are not as familiar with the complex rules on how to cast a valid vote.
Figure 4: Percent of error votes according to a municipality’s socio-economic index of inequality.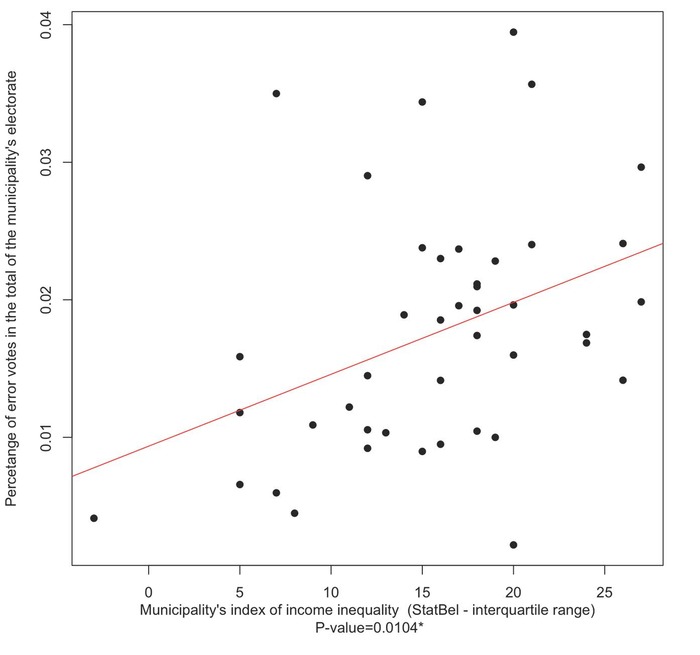
-
8 Conclusion
In this article, we pursued two objectives. The first was to deconstruct and describe what kind of ballots were contained in the bag of ‘blank and null votes’ and are therefore recorded as official election results. In all three Belgian regions, public authorities only publish a single aggregate figure of invalid votes by combining two distinct types of invalid votes – blank and null votes. In addition, no one is authorized to access ballots to obtain further details. In this article, we have had the unique opportunity to better understand the reality of these invalid votes. The Walloon regional authorities granted us access to a large sample of paper ballots cast by voters in the 2018 local elections. We obtained access to a sample of 13,243 invalid ballots from 49 municipalities across Wallonia. Using this unique dataset, we shed some light on the reality of invalid votes and opened the black box of blank and invalid ballots in local elections in Wallonia.
In order to open the “opaque blank box” we proceeded in several steps. First, we have shown that invalid votes consist of two-thirds of null votes and one-third of blank votes. Second, we re-categorized the null votes. About half of them can be classified as intentionally nullified ballots. The other half is made of ballots unintentionally nullified (i.e., voting errors). Besides, we have shown that these figures significantly varied across the 49 municipalities of our study. In particular, we have observed that election officials in some municipalities have been stricter in declaring ballots as invalid. With this observation we invite future researchers to pay more attention to the role of election officials in systems that use paper ballots for elections.
The second objective was to test some hypotheses to explain the variance observed across the 49 municipalities we studied. More specifically, we have tested the influence of factors driving intentional invalid votes – defined as blank ballots and intentional null votes – and unintentional invalid votes. The main findings provide several interesting insights. In particular, we observe that intentional invalid votes are more correlated to the socio-economic context of the municipality than to political factors. In particular, we distinctively observe that intentional invalid votes greatly increase in municipalities with a lower socio-economic performance score. Regarding unintentional invalid votes, the findings are slightly different. It appears that both political and socio-economic factors matter. Unintentional invalid ballots appear to be more frequent when the paper ballot becomes too wide, with too many lists and candidates. And it also appears to be more frequent in less affluent municipalities where there are more voters with lower levels of political sophistication. What would contribute to reducing invalid ballots by errors would be to make the electoral process simpler in terms of ballot presentation.
Regarding the social and political debates, the paper has underlined at least three relevant elements. First, there are huge variations across municipalities in the rate and types of null ballots. Part of it could be explained by variations in the way election officials implement the electoral rules. Second, an effort could be made to improve voters’ knowledge of the electoral systems; it seems that voters still do not understand the way a valid vote should be cast. Panachage remains frequent. Efforts in civic education and information must be conducted. Finally, whether to opt for paper or electronic voting is definitely a loaded decision. Both have their merits and limitations. But one limitation of paper voting is often ignored – it increases the likelihood that voters will cast an unintentionally invalid vote. This element has been largely overlooked in recent debates. Based upon our study, we can say that abandoning electronic voting probably had no strong impact on the rate of intentional invalid votes. Voters casting a blank ballot and voters intentionally spoiling their ballots could still refuse to vote by selecting the option ‘blank vote’ on the screen. Yet, there is also one-third of all invalid ballots that are invalid ballots due to ‘human mistakes’. In relative terms, it does not represent a large share of all eligible voters (around 1.7% of the electorate). But in absolute terms, it represents 44,668 eligible voters across Wallonia. Electronic voting, or other voting modalities that would reduce the risk of unintentional null votes, could have made a difference for them. This would directly prevent unintentional panachage, particularly in case of a lengthy list of candidates. Moreover, we can also underline that these invalid votes due to errors are especially a concern in some municipalities, such as those with more socio-economic inequalities – and therefore a higher rate of less politically sophisticated voters – and those where many party lists and many candidates are running. In such contexts, that are mostly found in urban areas, unintentional invalid votes may account for even larger segments of the electorate. In Liège, for example, it represented 3.33% of all voters who had cast a vote in the 2018 local elections. Clearly, such figures need to be considered when studying and debating the respective merits of electronic and paper voting.
These findings directly contribute, we argue, to relevant social and academic debates. At the scientific level, we have shown that blank and invalid votes in a country where voting is compulsory could be considered, for some voters, as one functional equivalent of abstention. About a third of all invalid ballots are blank ballots, and about half of the remaining ballots are ballots intentionally invalidated by voters. Such intentionally nullified ballots seem to be driven by the same kinds of factors as abstention: the socio-economic and political contexts. Also, there is a share of those invalid ballots that are due to unintentional errors. The literature should be further developed to examine these errors as well, in all three regions of Belgium and in other countries, especially those where voting is compulsory. Appendix Aldashev, G., & Mastrobuoni, G. (2019). Invalid ballots and electoral competition. Political Science Research and Methods, 7(2), 289-310.
Billiet, J. (2001). Opkomstplicht of vrijheid om al of niet te gaan stemmen? ISPO-Bulletin, n°44, KU Leuven.
Blais, A. (2006). What affects voter turnout? Annual Review of Political Science, 9, 111-125.
Braconnier, C. (2016). L’abstention et la participation électorale. In O. Filleule, F. Haegel, C. Hamidi, & V. Tiberj (Eds.), Sociologie plurielle des comportements politiques (pp. 39-67). Paris: Presses de Sciences Po.
Capoccia, G. (2002). Anti-system parties: A conceptual reassessment. Journal of Theoretical Politics, 14(1), 9-35.
Delwit, P. (1992). L’abstentionnisme politique en Europe et le cas belge. Cahiers Marxistes, n° 183, pp. 73-85.
De Maesschalck, F. (2018). Hoe representatief waren de gemeenteraadsverkiezingen van 2018? SamPol online. Retrieved from https://www.sampol.be/2018/12/hoe-representatief-waren-de-gemeenteraadsverkiezingen-van-2018.
De Winter, L., & Ackaert, J. (1994). Abstentionnisme et vote blanc ou nul: le non-vote en Wallonie. In Frognier André-Paul and Aish-Van Vaerenbergh Anne-Marie (Eds.), Elections: La fêlure? Enquête sur le comportement des Wallons et des Francophones (pp. 77-98). Brussels: De Boeck.
Driscoll, A., & Nelson, M. J. (2014). Ignorance or opposition? Blank and spoiled votes in low-information, highly politicized environments. Political Research Quarterly, 67(3), 547-561.
Hooghe, M., Marien, S., & Pauwels, T. (2011). Where do distrusting voters turn if there is no viable exit or voice option? The impact of political trust on electoral behaviour in the Belgian regional elections of June 2009. Government and Opposition, 46(2), 245-273.
Kouba, K., & Lysek, J. (2016). Institutional determinants of invalid voting in post-communist Europe and Latin America. Electoral Studies, 41(1), 92-104.
McAllister, I., & Makkai, T. (1993). Institutions, society or protest? Explaining invalid votes in Australian elections. Electoral Studies, 12(1), 23-40.
Nicolau, J. (2015). Impact of electronic voting machines on blank votes and null votes in Brazilian elections in 1998. Brazilian Political Science Review, 9(3), 3-20.
Pachon, M., Carroll, R., & Barragan, H. (2017). Ballot design and invalid votes: Evidence from Colombia. Electoral Studies, 48(1), 98-110.
Percheron, A., Subileau, F., & Toinet, M.-F. (1987). Non-inscription, abstention et vote blanc et nul en France. Espace Populations Sociétés, n°3, pp. 511-521.
Pion, G. (2010). Le vote blanc et nul en Wallonie: Analyse écologique et individuelle. Belgeo, n°3, pp. 249-264.
Power, T. J., & Garand, J. C. (2006). Determinants of invalid voting in Latin America. Electoral Studies, 26, 432-444.
Power, T. J., & Roberts, J. T. (1995). Compulsory voting, invalid ballots, and abstention in Brazil. Political Research Quarterly, 48(4), 795-826.
Stiefbold, R. P. (1965). The significance of void ballots in West German elections. American Political Science Review, 59(2), 391-407.
Uggla F. (2008). Incompetence, alienation, or calculation? Explaining levels of invalid ballots and extra-parliamentary votes. Comparative Political Studies, 41(8), 1141-1164.
Wauters, B., Verlet, D., & Ackaert, J. (2012). Giving more weight to preferential votes: Welcome or superfluous reform? The case of the local elections in Flanders (Belgium). Local Government Studies, 38(1), 91-111.
Zulfikarpasic, A. (2001). Le vote blanc: Abstention civique ou expression politique? Revue Française de Science Politique, 51(1), 247-268.
- * This research project has been conducted with the support of the Belgian FNRS (Fonds national de la recherche scientifique) and of the Walloon Regional Ministry for Local Affairs. We would like to thank in particular Séverine Karko and Julie Juvijns (SPW, DO pouvoirs locaux) for their support in getting access to the ballot papers.
-
1 In this study, we consider that when a voter cast a vote for more than two lists, it was no longer a mistake but a clear willingness to invalidate the ballot. On the other hand, when a voter only chose two lists, it was assumed to be a mistake. This operationalization does not rely upon previous studies but rather from the observation of our sample. The clear majority of ballots with panachage are either ballots with votes on two lists or with votes on (almost) all lists. Ballots with votes on three lists are marginal.
-
2 Until the 2014 regional, federal and European elections, null votes were still technically possible under very specific conditions. This is the case for voters who would – voluntarily or involuntarily – damage more than twice the magnetic card provided for the electronic vote. Under such circumstances, the president of the polling station had to cancel the votes (i.e., null votes) while preventing voters from any further attempts to vote.
| Provinces | Population | Sample | ||
|---|---|---|---|---|
| N | % | N | % | |
| Hainaut | 69 | 27% | 11 | 22% |
| Urban municipalities | 2 | 1% | 1 | 2% |
| Mix municipalities | 40 | 16% | 4 | 8% |
| Rural municipalities | 27 | 11% | 6 | 12% |
| Liège | 75 | 30% | 16 | 33% |
| Urban municipalities | 7 | 3% | 1 | 2% |
| Mix municipalities | 31 | 12% | 7 | 14% |
| Rural municipalities | 37 | 15% | 8 | 16% |
| Luxembourg | 44 | 17% | 8 | 16% |
| Mix municipalities | 5 | 2% | 2 | 4% |
| Rural municipalities | 39 | 15% | 6 | 12% |
| Namur | 38 | 15% | 8 | 16% |
| Urban municipalities | 1 | 0% | 1 | 2% |
| Mix municipalities | 6 | 2% | 2 | 4% |
| Rural municipalities | 31 | 12% | 5 | 10% |
| Brabant wallon | 27 | 11% | 6 | 12% |
| Mix municipalities | 18 | 7% | 4 | 8% |
| Rural municipalities | 9 | 4% | 2 | 4% |
| Total | 253* | 100% | 49 | 19% |
* There are 262 Walloon Municipalities, but the 9 municipalities from the Cantons of Eupen and Saint-Vith are under the authority of the German Speaking Community (Ostbelgien)