

-
1 Introduction
Belgium has long been described as a typical case of a consociational or consensus democracy (Lijphart, 1969; 2012). This model is regarded as effective in maintaining democracy in a country despite deep social divisions that are characteristic of plural societies – ‘societies that are sharply divided along religious, ideological, linguistic, cultural, ethnic, or racial lines into virtually separate subsocieties with their own political parties, interest groups, and media of communication’ (Lijphart, 2012, p. 31).
Initially, Belgium was labelled consociational by scholars on the basis of the way in which democracy could survive despite deep religious and economic divisions (Huyse, 1970; Lijphart, 1969). Later on, scholars maintained this label, but now tend to refer to relations between language groups (Lijphart, 2012; Pilet, 2005). These three lines of divisions (religious, economic and language divisions) are at the source of a deeply segmented society (Lorwin, 1966) divided into subsocieties or ‘pillars’ (Billiet, 1982; Deschouwer, 2009; Hellemans, 1990; Rokkan, 1977). These ‘pillars’ encapsulate citizens and organize groups politically and socially through a dedicated political party, a trade union, a social care institution and a multitude of other organizations. According to Deschouwer (2009, p. 5): ‘Belgium does indeed fit nicely into this crude description of a typical consociational democracy’, with a Catholic pillar, a socialist pillar, and a much smaller liberal pillar, and what could be described as linguistic pillars. Lijphart (2012) and Luther (1999) have stressed the specific role of parties in consociational democracies. Both scholars stress that parties are much more than political organizations: they represent an entire societal segment and support their demands, pacify the subcultures and accommodate divisions at the elite level.
As stated by Deschouwer (1994, p. 80), ‘the role played by parties under consociationalism explains a number of characteristics of their internal life’. Luther (1999) identifies three main features of parties in consensus democracies: (1) political mobilization and provision of values/incentives for the subculture, (2) hierarchical party control of the subculture, and (3) organizational penetration and incorporation of the subculture. This article aims at identifying whether in an era of de-pillarization and blurring of social boundaries (Deschouwer, 2009; Dobbelaere, 2017; Méndez-Lago, 2004) political parties in Belgium still share the internal characteristics of parties in consensus democracies. More specifically, we look at the following indicators:Mass membership (to measure feature 1);
Delegation of the search for a consensus from the members to the elites, and low level of political participation and activism (to measure feature 2);
Purposive and material incentives rather than ideological incentives to join parties (to measure feature 1);
Overlapping memberships with other organizations from the pillar (to measure feature 3), and
Social and attitudinal representativeness of a clear subculture (to measure feature 3).
The first part of the article deals with the first three dimensions: mass membership, delegation of power from the members to the party elite and passivity. The second part of the article investigates how parties are (still) representative of a specific subculture in Belgium by looking at both overlapping memberships and representativeness. We use several data sources: longitudinal party membership data (van Haute & Paulis, 2017) and party member surveys (listed on www.projectmapp.eu, including information on response rates) conducted in three different time periods: data collected by ULB researchers (PS 2003, Ecolo 2004, OpenVLD 2006 and CD&V 2006; van Haute, Amjahad, Borriello, Close & Sandri, 2013), data collected by UGent researchers (OpenVLD 2012, N-VA 2012, CD&V 2013, Groen 2013, sp.a 2015; Wauters, 2017), and brand new data collected in 2016 and 2018 within the international MAPP project. For the Belgian part of this MAPP-survey, all parties represented in the federal parliament received an invitation to participate. To date, six parties (Ecolo in 2016 and CD&V, Groen, N-VA, sp.a and OpenVLD1xOwing to the very low response rate of OpenVLD in this survey, we leave them out of the analysis here. in 2018) have participated in the project and have distributed the online survey. In total, 12,639 members filled in this questionnaire, making this the largest party member survey ever in Belgium. The various types of data we use can be considered a robustness check of our findings throughout time.
By analysing parties’ internal life, this article indirectly refers to the role played by parties in Belgium’s democracy. In doing so, it contributes to an evaluation of the extent to which Belgium still fits Lijphart’s model of consociational democracy at its very core. Indeed, as Deschouwer points out (2009, p. 8), ‘the cleavages on which the pillarized organization of Belgian society was built have now deeply eroded’. If this statement holds, our analysis should show a transformation of parties in these core characteristics. -
2 Party membership levels
The available data on party membership in Belgium based on parties’ own records tends to confirm that mass membership has sharply declined in Belgium (van Haute & Paulis, 2017). In particular, the parties embodying the idea of pillar parties (Christian Democrats – CD&V and CDH, and Social Democrats – sp.a and PS) have seen their membership numbers decline drastically since the early 1990s (Table 1). They have sometimes more than halved their membership figures in two decades: the CD&V went from 120,000 to 60,000, the CDH from 30,000 to less than 15,000, and sp.a peaked near the 100,000 mark to drop below 45,000 in 2014. The PS has also faced a sharp decline, from up to 160,000 members in the early 1980s, to stabilize between 80,000 and 90,000 in the 2000s.
The Liberals (OpenVLD, MR) have their roots as a cadre party. They had never fully embraced the mass membership feature of the other pillar parties. Over time, they have faced fluctuations but are characterized by stability in the long term: around 65,000 for the OpenVLD and between 25,000 and 30,000 for the MR.
Mass membership may be a feature from the past, but party membership is not. Other parties in the party system have faced brighter trends. The Greens (Groen, Ecolo) have experienced a growth until early 2000s, followed by a decline after their governmental participation at the national level. Both parties have recovered, albeit at a different pace, to stabilize around 6,000 members. As for the Regionalists (VU and N-VA, DéFI), the VU faced a peak in the 1970s, concomitant with its electoral peak. The next two decades were characterized by a sharp decline in membership levels that split the party. The N-VA picked up the VU’s membership and regrew it (in line with their electoral growth) to reach around 40,000 in the mid-2010s. DéFI has always been a much smaller party, mainly restricted to Brussels and its periphery. At its peak in the 1970s it declared 15,000 members, down to around 5,000 mid-2010s.
The Flemish Radical Right (VB) was characterized by constant growth of membership, which peaked at 25,000 in 2010. The party’s membership declined, for the first time, in the first half of the 2010s, to 17,000. The Radical Left (PVDA-PTB) is characterized by membership growth in the 21st century and declared in the mid-2010s to have around 10,000 members in Belgium (as this is the only ‘national’ party in Belgium).Table 1 Evolution of party membership figures (M) in Belgium, 1945-2014PC Groen Ecolo sp.a PS VU N-VA DéFI CD&V CDH OpenVLD MR VB PTB 1946 76,194 X X 38,838 56,422 X X X X 1947 57,295 X X 44,805 60,329 X X X 91,790 39,604 X 1948 44,683 X X 44,741 68,460 X X X 120,162 50,070 X 1949 38,361 X X 50,026 73,702 X X X 158,439 57,569 X 1950 24,360 X X 54,040 73,118 X X X 71,679 27,481 X 1951 22,215 X X 54,504 80,084 X X X 80,782 32,299 X 1952 19,276 X X 58,160 89,473 X X X 101,221 32,602 X 1953 17,000 X X X X X 129,941 56,216 X 1954 16,239 X X 66,625 86,389 X X 53,821 X 1955 14,265 X X X X 186,858 60,915 X 1956 13,664 X X 72,237 100,293 X X 173,599 62,404 X 1957 11,794 X X 76,414 106,082 X X 171,633 72,869 X 1958 11,328 X X 78,280 108,720 X X 182,399 70,064 X 1959 11,345 X X X X 150,021 68,493 10,961 X 1960 11,589 X X 87,155 111,845 X X 153,445 60,306 18,000 X 1961 X X 2,511 X X 137,830 70,555 X 1962 14,465 X X 6,835 X X 125,013 45,030 X 1963 14,064 X X 8,761 X X 121,009 42,876 X 1964 14,157 X X 87,775 116,725 9,235 X X 116,457 41,204 X 1965 14,320 X X 86,095 103,208 12,630 X 101,437 X 1966 13,421 X X 87,074 116,628 17,233 X 109,592 38,573 X 1967 12,927 X X 90,899 111,040 19,294 X 104,038 41,784 X 1968 12,159 X X 93,523 114,015 24,997 X 114,843 34,400 X 1969 11,634 X X 96,241 119,532 30,535 X 112,655 28,390 28,121 X 1970 10,553 X X 99,760 125,719 35,916 X 107,945 39,336 X 1971 10,012 X X 102,327 133,008 40,795 X 105,652 45,998 29,134 X 1972 9,953 X X 106,553 134,764 45,801 X 101,230 45,496 31,074 28,433 X 1973 9,570 X X 112,312 138,025 50,118 X 10,000 102,421 37,719 34,241 X 1974 9,450 X X 112,609 141,853 49,940 X 10,881 114,369 47,422 37,257 X 1975 9,600 X X 110,855 143,138 51,711 X 10,990 120,730 52,042 43,794 34,700 X 1976 9,523 X X 109,253 145,577 50,989 X 10,518 126,053 51,604 48,369 X 1977 9,269 X X 108,424 144,146 51,878 X 131,636 56,301 54,788 X 1978 8,792 X X 111,943 147,269 53,067 X 125,219 61,049 57,520 42,000 X 1979 8,790 X X 112,883 147,786 45,885 X 117,379 43,568 55,835 824 1980 8,135 X X 113,922 154,798 49,563 X 125,141 57,904 58,625 1,231 1981 7,583 116,730 167,087 46,671 X 12,000 125,001 54,021 60,926 47,233 1,607 1982 6,846 870 900 114,181 161,649 47,410 X 123,394 52,732 66,336 54,161 2,435 1983 5,957 111,798 149,289 50,322 X 13,080 112,156 45,918 69,329 62,093 2,821 1984 5,528 835 754 108,500 150,671 52,263 X 11,500 117,286 42,954 72,480 66,722 3,269 1985 5,446 925 837 108,223 140,462 50,890 X 10,200 115,633 41,388 73,631 70,514 3,698 1986 5,044 1,113 781 106,513 138,820 49,072 X 14,194 127,695 41,837 73,647 73,727 4,004 1987 3,372 1,375 565 103,546 145,298 49,164 X 13,488 139,266 42,838 75,339 76,298 4,213 1988 3,134 3,000 813 97,785 142,154 47,582 X 133,628 31,485 75,227 45,824 2,458 1989 2,662 2,499 1,296 99,112 134,926 43,898 X 10,587 125,768 31,979 75,390 46,430 2,630 1990 2,130 1,135 94,760 130,894 40,322 X 131,719 31,599 71,051 35,884 3,452 1991 2,038 1,244 97,919 129,051 36,162 X 131,722 31,432 66,381 35,324 4,069 1992 2,529 1,722 93,351 127,492 32,089 X 126,426 33,468 66,783 34,404 4,682 1993 2,609 1,756 89,085 128,465 27,696 X 124,747 32,565 80,455 35,273 6,131 1994 3,786 2,161 83,956 124,081 21,831 X 121,400 32,769 82,804 34,015 7,372 1995 600 3,985 2,290 80,582 117,533 15,637 X 108,671 30,569 79,561 33,121 9,322 1996 3,273 1,909 77,695 112,731 19,833 X 116,682 30,622 78,287 35,463 10,038 1997 3,404 2,144 75,816 109,194 18,487 X 112,109 28,492 79,512 37,795 10,048 1998 3,701 2,430 74,058 107,581 16,860 X 108,441 26,203 76,941 38,885 11,218 1999 4,281 2,738 71,386 103,713 15,504 X 105,939 25,283 75,780 38,904 14,424 2000 6,171 3,817 67,643 95,765 15,624 X 103,535 21,262 79,850 38,700 17,167 2001 6,158 3,789 63,083 89,694 11,543 X 98,015 19,811 80,049 37,900 17,356 2002 5,354 4,189 66,411 82,470 X 9,931 88,890 19,115 75,252 35,870 17,544 2003 6,078 3,560 61,637 82,399 X 11,464 86,816 19,823 73,438 34,485 16,860 2004 6,153 3,100 62,779 83,105 X 10,594 81,819 22,412 72,748 29,820 17,892 2005 5,405 2,987 60,842 X 9,823 84,173 25,125 71,763 30,630 21,942 2006 5,462 4,217 55,599 95,282 X 10,411 83,180 26,305 72,475 30,131 25,090 2007 4,537 4,890 53,814 78,365 X 9,448 79,596 28,353 67,149 30,686 25,000 2008 4,459 5,006 52,431 X 10,217 76,848 26,104 67,061 28,549 23,850 2009 4,708 5,816 51,641 X 11,477 71,287 25,416 66,135 25,616 22,500 2010 5,075 6,068 52,751 81,491 X 15,799 26,027 66,662 25,739 2011 6,249 5,741 52,930 90,700 X 25,483 5,312 66,810 12,088 66,211 29,883 17,139 2012 7,855 6,227 50,737 91,164 X 36,439 5,821 66,031 14,630 66,232 27,004 16,433 2013 5,856 46,813 X 35,582 65,452 17,139 7,662 2014 44,574 X 41,543 65,866 17,255 9,692 2015 43,235 X 41,544 64,720 17,789 9,922 Note: Smaller or short-lived parties not in table; X = the party did not exist that year; empty cells = missing values. Source: www.projectmapp.eu (Van Haute & Paulis, 2017).
Figure 1 summarizes these trends and presents the party membership ratio (M/E) in Belgium over time. It is a relative measure of the total number of members of the electorate at the country level. It depicts the percentage of voters who are members of a political party. In the early 1960s, about 4% of voters in Belgium were also members of a political party. This proportion grew to almost 10% at the end of the 1970s and stabilized in the 1980s. The 1990s and 2000s were characterized by a decline that brought the membership ratio back to around 5%. This ratio has stabilized in the 2010s.
In comparative terms, the membership ratio has always been higher in Belgium than in most European countries (van Biezen, Mair & Poguntke, 2012). At the end of the 1990s, Belgium was among the top five (out of 20) of the countries with the highest membership ratio in the EU, alongside Austria, Cyprus and Italy, other countries often characterized as consensus democracies. It still ranked 6th out of 27 in 2008 and second last in terms of membership losses.Figure 1: Evolution of party membership ratio to the electorate for pillar parties (Social Democrats and Christian Democrats) and all parties (M/E) in Belgium, 1961-2014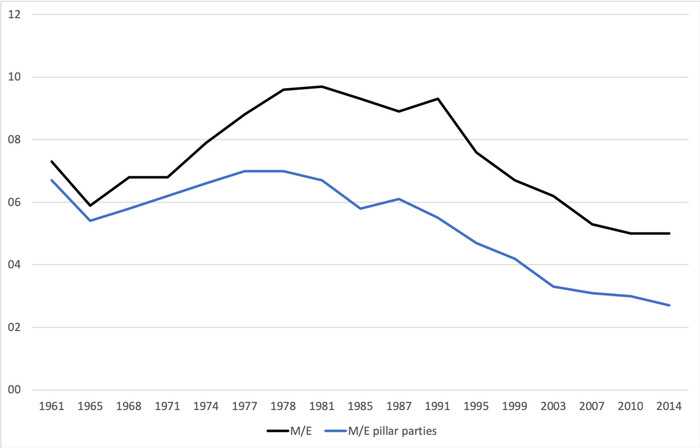 Note: Total number of party members (M) sometimes calculated with missing values (1961: French-speaking Liberals; 1965: FDF and French-speaking and Flemish Liberals; 1968: DéFI and French-speaking Liberals; 1971, 1995, 1999, 2003: DéFI; 2007: DéFI). For some election years, data is an estimate based on the previous year, the next year or an average between the two (24 observations).
Source: www.projectmapp.eu.Thus, overall, the analysis reveals a clear drop in mass membership in the former pillar parties, which severely affects the country’s overall membership ratio. As Marien and Quintelier (2011) have shown, group memberships in general are eroding. This partly explains the decline in mass membership for the Christian Democrats and the Social Democrats in Belgium, as group membership in other related organizations constituted a large reservoir of members for pillar parties via overlapping memberships (see below). New parties have only partly benefited from this. In Flanders, it is especially the case of VB and Groen in the 1990s and 2000s, and the N-VA in the 2010s. The growth of the N-VA could be a sign of a new pillarization on the linguistic divide, with the N-VA trying to occupy the position of the pillar party embodying the Flemish side of that cleavage. However, these new parties have been unable to attract members at the same rate as former pillar parties in the 1970s and 1980s, and this explains the overall decrease in the M/E ratio.
It is necessary, however, to temper these conclusions with the following nuances.
First, as Figure 1 shows, the membership ratio is today very similar to what it was fifty years ago (in the 1960s). As Scarrow (2000) points out, the comparison over time always depends on the starting point that is taken for that comparison. In that regard, the very high levels of the 1970s and 1980s can be regarded as the exception rather than the norm.
This exceptional situation could occur, at least partially, owing to errors in the membership logs of parties. These errors may be involuntary and related to the difficulties of maintaining a membership list up to date in those days without the modern tools and technologies. Today, the information can easily be shared between the central level and local branches, and each individual fee can be traced back to an individual member via bank transfer references. These errors may also be part of a purposive strategy. Parties are not exempt from internal battles between local branches. As a party secretary confided (interview, 19 January 2016), the membership figures were crucial for local branches, as they determined the allocation of delegates at the party conference. Local branches sometimes paid fake membership fees in order to inflate their number of delegates, and hence their weight at the party conference, up to the point that some even faced bankruptcy. These voluntary inflations have become less important since most parties have replaced their representative system with party delegates by a direct involvement of individual members (for both leadership selection and participation in party conferences) (Pilet & Wauters, 2014).
Another indication is that in recent decades, the subjective measures of party membership based on population surveys (in which respondents are asked whether they are members of a political party) have tended to converge with the objective measure based on parties’ declarations much more than in the past. Marien and Quintelier (2011, p. 56) emphasized that for the 1980s and 1990s, the membership ratio based on parties’ declaration is two or three times higher than the ratio based on population surveys. Since the end of the 1990s, both ratios have been much closer.
The 2009 Partirep Voter survey conducted in Flanders and Wallonia showed that 5.7% of the respondents were members of a party (7.7% in the 2014 Partirep Voter Survey) and that 4.8% were former members (7.2% in 2014). Besides, in 2014, 6.5% of the respondents declared that they were not party members but nevertheless had been participating in party activities. This means 78.5% of the respondents never had a link with parties. These proportions are close to what we find on the basis of parties’ reported memberships.
These nuances point to the fact that mass membership seems to be an exception that concerned only certain parties (Christian Democrats and Social Democrats) at a very specific point in time (1970s and 1980s), partly owing to the specificities of pillar parties in Belgium, but also owing to other more pragmatic factors. -
3 Political participation and party activism
The second feature of parties in a pillarized society is, traditionally, the low level of political participation and party activism.
In 1975, an internal party member survey had highlighted the low level of activism of members of the Flemish Christian Democrats (CD&V, then CVP):Not all members are convinced followers. No less than a quarter of the members think that their bond with the party is “weak” or that they are “at odds” with the party. The number of active members amounts to 30% according to the same survey (cited in Dewachter, 2003, p. 262).
Twenty years later, Deschouwer and Opsomer (1993) pointed out that there was no negative trend in activism in Belgium but rather that activism varied according to parties, with new parties (Regionalists and Greens) having more active members than pillar parties. This is also what van Haute et al. (2013) emphasized on the basis of party member surveys. Members of pillar parties are the least active, as reflected by the declaration of a majority of members that they devote no time at all to their party (52% in the PS, 57% in the CD&V and up to 63% in the OpenVLD), as opposed to a quarter of the French-speaking Greens (Ecolo). Also Devroe and Van de Voorde (2017) find that most party members are not very active in their parties, although it depends on the kind of activity (more into campaign activities) and the kind of party (Groen members are most active, N-VA least active).
The results of the recent MAPP surveys show that these figures are still very stable: a quarter of the French-speaking Greens do not devote any time to their parties (Ecolo 2016). This amounts to a third for the pillar parties (35.4% for sp.a 2018) and up to 40.8% for N-VA (2018). This is in line with other existing studies (van Haute, 2015).
Thus, there is no clear decline in levels of activism among party members. The specificity is in the contrast across parties in Belgium. In line with our expectation, Green party members are, on average, more active than members of former pillar parties. What stands out is the (recent) low rate of activism of members of the N-VA (especially also in comparison with its predecessor VU). This could be another sign that this party recently displayed at least some features of a pillar party (large but passive membership).
The nature of party activism has also changed over time in response to the changing role that parties assign their members. Under the pressure of the rise of new parties, membership decline and the wish to strengthen the position of the party leader (Wauters, 2014), almost all Belgian parties (including pillar parties) have taken on board the rhetoric of internal democratization. By democratization, parties have meant more inclusiveness, that is, replacing the delegation mechanisms by a more direct say to their members (OMOV – one member one vote) in the core decision-making processes such as leadership selection (Pilet & Wauters, 2014) and manifesto formulation. At the same time, party executives have managed to retain control and leadership strength (Deschouwer, 1994, p. 87). In particular, they have managed to control candidacies for leadership elections via stricter conditions and the mechanism of an ‘ad interim’ party leader: putting the party executive’s preferred candidate as interim leader a couple of months ahead of the election to send a signal to the members that this is the ‘legitimate’ party leader to elect over potential challengers. Ultimately, in almost 50% of the leadership elections using the OMOV system, only one candidate was running, and in the majority of the other cases, there was no real contest. The average margin between the top two finishers is 30.5 percentage points (Pilet & Wauters, 2014, p. 39). -
4 Incentives to join parties
Lastly, pillar parties would be characterized by different motivations for joining and by higher levels of processual and material motivations and lower levels of ideological motivations. Over time, we would expect that de-pillarization should re-ideologize parties and party membership.
Our results tend to confirm the first pattern (Table 2). When asked about their reasons for joining the party, members of the Flemish Christian Democrats and Social Democrats display the highest levels of material incentives (joining for a career or job), of joining owing to social habit, or to meet people and acquire new skills (although Ecolo scores high on this last dimension too). Members of these pillar parties also display the lowest levels of ideological motivations. Interestingly, pillar parties also show higher levels of members stating that they joined in continuation of prior engagements or with a view to promoting a specific issue, which we may relate to the overlapping memberships that characterize pillar parties (see also below). Conversely, new parties distinguish themselves by higher (N-VA) and lower (Groen, Ecolo) levels of members who joined to support the party. The high levels among the N-VA might reflect the newness of the party. The weight of ideological incentives in the recruitment patterns of the N-VA makes a strong case against characterizing it as a pillar party.Table 2 Reasons for party members’ joining (1-4)CD&V 2018 Groen 2018 N-VA 2018 sp.a 2018 Ecolo 2016 Party support1 2.4 2.2 2.7 2.4 1.8 Processual incentives2 2.8 2.4 2.4 2.6 2.8 Material incentives3 1.7 1.4 1.4 1.6 1.3 Social habit4 3.0 2.0 2.1 2.6 1.4 Issue5 2.6 2.2 2.0 2.6 2.5 Ideological incentives6 2.8 3.1 3.3 3.0 3.2 1 Scale built on the following items: ‘To support the party financially’, ‘To support a candidate for elections’, ‘To support a candidate for the party’s leadership’, and ‘Because I had a great appreciation of the leader of the party’. Cronbach’s alpha = 0.744.
2 Scale built on the following items: ‘To meet interesting people and extend my social life/participate in social activities’, ‘To get new skills and/a better understanding of politics’, ‘To meet politically like-minded people’. Cronbach’s alpha = 0.754.
3 Scale built on the following items: ‘Because I wanted to pursue a political career in the party’ and ‘I thought it would help my career/to get a job’. Cronbach’s alpha = 0.586.
4 Scale built on the following items: ‘It was customary in my environment’, and ‘Because someone asked me to’. Cronbach’s alpha = 0.477.
5 Scale built on the following items: ‘It was a continuation of other engagements’, and ‘I wanted to influence the party on a particular issue’. Cronbach’s alpha = 0.329.
6 Scale built on the following items: ‘Because I believed in what the party stands for’ and ‘To oppose other political parties’. Cronbach’s alpha = 0.436.
Source: MAPP surveys; Note = 1 = not important at all; 4 = very important.As regards change over time, differences in the questions asked in prior surveys preclude a systematic comparison. However, previous findings also pointed to higher levels of material incentives among the pillar parties (CD&V, PS and OpenVLD) and lower levels among the Greens (Ecolo) that displayed higher levels of ideological motivations (van Haute et al., 2013). Thus, the path to party membership still tends to differ across parties.
-
5 Social representativeness
The last two features that we investigate are the social and attitudinal representativeness of party members and their overlapping memberships, in order to identify whether they (still) represent a clear subculture.
To this end we investigate the extent to which political parties are composed of traditionally related social groups. More specifically, we are interested in religion and profession, two of the traditional cleavages on which the party system in Belgium has been built (Huyse, 1970; Lipset & Rokkan, 1967). We also investigate whether parties are characterized by overlapping memberships of specific ‘pillarized’ organizations, including trade unions and public health insurance companies.
In terms of religious orientation of party members (Table 3), the results clearly reflect the traditional patterns in terms of religious attachment: the Flemish Christian-Democratic Party (CD&V) is almost entirely composed of Roman Catholics (89%), while the sp.a and also both Green parties (Groen and Ecolo) are largely composed of non-believers 80.7%, 70.8% and 65.1%). These findings are in line with earlier research that found that the OpenVLD (2006) and the PS (2003) also relied on non-believers, although the Greens have changed on this characteristic in the last decade, counting more non-believers among their members (Devroe, de Vet & Wauters, 2017; van Haute et al., 2013). The proportion of Roman Catholics among the CD&V is only slightly lower than in previous surveys (97.2% in 2006 and 92% in 2013). The N-VA presents itself as a party cutting across the religious cleavage: it is composed almost equally of Roman Catholics and non-believers.
In regard to religious practice (not in the table), CD&V members are most active, but only 23% of CD&V members go to church every week. These trends are linked to the secularization of Belgian society, but despite that, the lines are still very clearly defined across parties.Table 3 Religious orientation of party members (%)CD&V 2018 Groen 2018 N-VA 2018 sp.a 2018 Ecolo 2016 Roman Catholic 89.0 23.0 51.4 14.9 26.2 No religion 9.4 70.8 45.2 80.7 65.1 Other 1.6 6.2 3.4 4.4 8.7 Source: MAPP surveys.
Another cleavage on which the Belgian party system is built is the socio-economic cleavage, embodied here by the professional occupation of party members. Again, distinctive patterns emerge (Table 4). N-VA counts most self-employed and business owning party members (22%), while for the Social-Democratic party, sp.a, the largest proportion of their members works in the public sector broadly defined (59%). N-VA has also relatively the largest group of members working in the private sector (39%). OpenVLD (in 2006) presents a similar profile, with a high proportion of self-employed and business owners compared with the case in other Flemish parties. The OpenVLD also had a majority of its members working in the private sector. The differences among other parties are smaller. The sp.a and the PS, and, to a lesser extent, Groen and Ecolo have a majority of their members working in the public sector. The CD&V has the most transversal profile in terms of professional status of its members but was and still is characterized mainly by a large proportion of members who are retired.
Table 4 Professional occupation of active party membersCD&V 2018 Groen 2018 N-VA 2018 sp.a 2018 Ecolo 2016 Self-employed/business owner 16.3 11.0 22.7 6.1 12.6 Employed by a private company 36.3 36.6 39.6 34.6 35.8 Employed in the public sector (hospital, school, government agency, etc.) 47.4 52.4 37.7 59.3 51.6 Source: www.projectmapp.eu
-
6 Overlapping memberships
In consociational democracies such as Belgium, parties are the voice not simply of a specific group, but of specific pillars composed of several organizations most often combining religious and socio-economic affiliations (Lijphart, 1969). One feature of pillar parties is overlapping memberships, that is, party members who are also affiliated to other organizations of the pillar, which facilitates recruitment.
Not much data is available for the early years. Dewachter (2003, p. 262) refers to an internal survey that was conducted among the Flemish Christian Democrats (then CVP) in 1975, which reveals that[a]lmost two-thirds of active CVP members are also members of a socio-professional organization and 41% are also members of a cultural association. About a quarter of these members are also active in these organizations. The group of militants is of course much broader than that of the active members.
Clearly, the party was characterized by overlapping memberships with those of certain other organizations, which we can assume were related to their pillar. In order to determine whether this is still the case, we rely here on data pertaining to trade union membership (Devroe et al., 2017).
Only the Social-Democratic party has a majority of its members affiliated to a trade union (Table 5) and almost exclusively with the union related to the socialist pillar (ABVV-FGTB). The same goes for the PS (2006, not in the table). In other parties, union members are not a majority, but we can nevertheless distinguish the same patterns on which the Belgian party system has been built: members of the CD&V are almost exclusively affiliated to the Christian trade union (ACV-CSC), and a very large majority of the members of OpenVLD affiliated to the (smaller) liberal trade union (ACLVB-CGSLB). The members of the Green parties tend to be affiliated to the two main unions, while those of N-VA display the lowest level of unionization, and when affiliated their members tend to choose the Christian trade union. The same patterns are replicated when we analyse membership of health insurance companies.Table 5 Trade union membership of party membersCD&V 2013 Groen 2013 N-VA 2012 OpenVLD 2012 sp.a 2015 ACV-CSC 37.0 28.8 16.6 6.0 4.6 ABVV-FGTB 0.6 15.8 3.4 0.7 47.2 ACLVB-CGSLB 0.2 1.4 1.1 13.7 0.9 No trade union 62.1 53.2 78.1 76.3 47.2 Source: Devroe et al. (2017).
In sum, it is striking to see how former mass-pillar parties are still very much recruiting in their classe gardée and are dominated by overlapping memberships. The Christian Democrats, Social Democrats and Liberals clearly continue to recruit in their own societal segments. What is also striking is that sister parties on the two sides of the linguistic border share very similar features. We only have some elements of comparison for the Social Democrats and the Greens, but they clearly point to similarities, as shown for other aspects of sister parties (Deschouwer, Pilet & van Haute, 2018). Finally, it should be noted that these features are eroding but at a very slow pace.
-
7 Attitudinal representativeness
In this section, we investigate whether the representation of different segments of society in parties also applies to opinions about policy issues. In other words, we analyse the extent to which party members are representative of certain sides of cleavages and incarnate democratic pluralism.
We start by analysing where party members position themselves and their parties on a classic left (0) to right (10) scale (Table 6). Our results show clear differences in left-right orientation between members of different parties. N-VA members are more rightist than CD&V members, who in their turn are more to the right than members of Groen, Ecolo and sp.a. However, this distribution on the left-right scale masks the diversity of issues that divide Belgian society and that lay at the origin of the development of a plurality of parties.
In order to capture this, we examine more closely the differences in opinions between parties by looking at five policy dimensions on which parties originated (or have realigned on). These dimensions include globalization (attitude towards migration and the European Union), the socio-economic dimension (opinion about the role of the government in wealth redistribution), the moral-ethical dimension (opinion on issues such as same-sex marriage and abortion), the post-materialism dimension (opinion on whether protection of the environment or stimulating the economy should gain priority) and the decentralization dimension (opinion on more autonomy for the regions in Belgium).Table 6 Average position of party members on policy scalesCD&V 2018 Groen 2018 N-VA 2018 sp.a 2018 Ecolo 2016 Left-Right (0-10) 5.6 2.8 7.3 2.9 2.9 Globalization:1 open vs. closed (1-5) 2.9 2.2 3.6 2.8 2.2 Socio-economic:2 left vs. right (1-5) 2.7 2.1 3.4 2.1 1.8 Moral-ethical:3 progress vs. conservative (1-5) 2.4 1.7 2.0 1.7 1.7 Post-materialism:4 environment vs. economy (1-5) 2.6 1.5 2.8 2.1 1.4 Decentralization:5 Belgium vs. Flanders (1-5) 2.9 2.2 4.3 2.3 2.4 1 Scale built on the following items: ‘Immigrants are good for this country’s economy’ and ‘Our country on balance has benefited from being a member of the European Union’ and on these reversed coded items: ‘Immigrants should be required to adapt to the customs of this country’, ‘Immigration represents a serious threat to our national identity’, ‘European integration has gone too far’. Cronbach’s alpha = 0.822.
2 Scale built on the following items: ‘Providing social services should be the prime goal of government’ and ‘Income and wealth should be redistributed towards ordinary people’ and on these reversed coded items: ‘The government should abstain from intervening in the economy’, ‘Many public services could be run better and more cheaply if they were privatized’, ‘Too many people receive social benefits without really needing them’. Cronbach’s alpha = 0.729.
3 Scale built on the following items: ‘Women should be free to decide on matters of abortion’ and on this reversed coded item: ‘Same-sex marriages should be prohibited by law’, ‘We believe too often in science and not enough in feelings and faith’. Cronbach’s alpha = 0.508.
4 Scale built on the following item: ‘Stronger measures should be taken to protect the environment’ and ‘Our country should implement a carbon tax’ and on these reversed coded items: ‘Nuclear power stations are the solution for a shortage of energy in the future’. Cronbach’s alpha = 0.610.
5 Scale built on the following reverse coded items: ‘More power should be delegated to the regions’ and ‘The solidarity between the regions of our country is necessary but it has gone too far’. Cronbach’s alpha = 0.784.
Note: Variances are always equal, Anova: F(glob) = 2148.446***, F(soc) = 3201.326***, F(mor) = 539.308***, F(env) = 1470.087***, F(dec) = 4516.765***.
Source: MAPP surveys.Our results show that members of different parties clearly differ on all dimensions of these issues (confirmed by Anova analyses). Party members tend to differ the most from members of other parties on issues that could be considered the ‘core business’ of their party. It is the case for the Christian Democrats (CD&V), who position themselves the furthest on the conservative side of the progressive-conservative scale. It is also the case of the Social Democrats (sp.a), who position themselves the furthest on the left side of the socio-economic scale, albeit together with the Greens (Groen, and Ecolo). The members of Groen and Ecolo position themselves the furthest to the post-materialist side of the environment-economy scale. Similarly, they are of the furthest open side of the globalization scale and opposed to the members of the N-VA on that scale. The N-VA members are the furthest on the ‘Flanders’ side for the decentralization scale.
Differences between members of all parties are the largest for the decentralization dimension and the globalization dimension, and the smallest for the moral-ethical dimension. Although for a number of policy dimensions, the members of Groen and sp.a display very similar positions, the differences on the globalization and post-materialism scales are more marked. These results confirm findings based on previous surveys (Bouteca, Devos & Van de Voorde, 2017). And it is also again striking to see the similarities in the positions of members from the same party family (Greens), as Deschouwer et al. (2018) had shown for other party levels (MPs and voters).
All this clearly emphasizes that party members in Belgium differ ideologically and represent different societal groups with different interests and opinions. Despite claims about ideological convergence between parties (Downs, 1957; Fukuyama, 1992; Meguid, 2005), our data clearly shows that party members do not think alike. -
8 Conclusion
In this article we set out to identify whether political parties in Belgium share the internal characteristics of pillar parties in consensus democracies. More specifically, we investigated whether pillar parties are (still) characterized by whether passive mass memberships, purposive and material incentives are important for joining, and representation of a clear subculture in the social and attitudinal profiles of their members and via overlapping memberships with related organizations. We showed that high levels of mass membership are an exception that concerned only the main pillar parties (Christian Democrats and Social Democrats) at a very specific point in time (1970s and 1980s). Our analysis revealed that this exceptional feature is partly due to the specificities of pillar parties in Belgium, but also due to other more practical factors. If mass membership is a feature mainly from the past, party membership is not. Other parties (Greens, Regionalists, Radical Right and Radical Left) have faced membership stability or growth, albeit never in the proportions of former mass membership parties. The N-VA is an exception in this regard, as the party achieved high membership levels that rival the current levels of former pillar parties. We can conclude that current party membership levels are lower than they used to be but that it also depends on the point of reference.
We have also shown that activism is lower in pillar parties, with little change over time, in contrast to the case with other parties, especially the Greens, which display higher levels of party activism. Again, the N-VA recently stands out with a passive membership. This tends to confirm what Weldon (2006) had noted: smaller polities tend to display higher participation rates.
But pillar parties are not characterized by mass membership alone. The nature of membership also differs, especially insofar as the role granted to members and the membership recruitment patterns are concerned. In terms of role and rights granted to members, pillar parties in Belgium have been pushed to adopt more inclusive decision-making processes, especially in regard to designating the party leader. Today, members tend to exercise rights previously granted to party delegates. However, various mechanisms ensure that the party executive still exerts a tight control over the leadership selection process. Besides, our analysis confirms that the incentives for joining still differ across parties and that pillar parties are characterized by higher proportions of members who declare that material and social reasons were important in their decision to join the party. Conversely, other parties display higher proportions of members who cite ideological reasons for joining. These results are consistent over time and do not reveal strong changes in the incentive structure of pillar parties.
The profile of members who are recruited by pillar parties is also rather stable over time. Pillar parties still overwhelmingly recruit members who are representative of a specific subculture, be it in terms of religious orientation, socio-economic status or overlapping memberships. Despite major societal changes, pillar parties have a hard time recruiting beyond their classe gardée. This can also explain why they are facing membership erosion. All parties also recruit members who clearly adopt distinctive policy positions, especially on the cleavage that forms the ‘core business’ of the party. What our results show is that these profiles are very congruent across the linguistic border, between parties from the same family. While we do not have data from all parties to support that claim, it tends to confirm what Deschouwer et al. (2018) have shown about sister parties in Belgium: despite fewer contacts, the social and ideological profiles are still very similar.
By analysing parties’ membership base, this article addresses the role played by parties in Belgium’s democracy and the extent to which Belgium still fits the model of consociational democracy. Our analysis shows that despite deep societal changes, pillar parties did not face major transformations in their core characteristics.
Understanding the characteristics and roles of parties in relation to subcultures over time is crucial. In consociational democracies, the role of parties in representing these social divisions is traditionally translated into institutional arrangements and political practices. In terms of institutions, Lijphart (2012) especially focuses on how this relates to executive power sharing in broad coalition cabinets, relatively weak executives, a multiparty system, proportional representation, interest group corporatism, federalism, bicameralism, constitutional rigidity, judicial review and central bank independence. Politically, segmentation is related to power sharing between elites and autonomy of the subsocieties.
Our analysis points to societal changes that were not translated into party change for pillar parties or into institutional changes in regard to the religious and socio-economic cleavage. Pillar parties continue to exercise their role of mobilization and representation of societal segments, but these segments tend to become smaller over time and parties face difficulties in extending their reach beyond their classe gardée. As regards the linguistic cleavage, the N-VA presents itself as the party embodying the Flemish side of the cleavage. With a large, passive membership, one could assume that it plays the role of a new pillar party. However, the party’s membership is more ideological than the classic pillar parties, ideological reasons play a more central role in the reasons for joining and members adopt very radical views on the centre-periphery cleavage. Furthermore, the party elite does not share the classic features of consensus seeking and power sharing (Beyens, Deschouwer, van Haute, Verthé, 2015), and they do not have a clear counterpart to build compromises with. Belgian parties are at the crossroads: they have to respond to societal changes and rethink how they can organize mobilization and representation while at the same time work with institutions that were conceived for consociational purposes. The question remains whether they will be able to bridge that gap or contribute to deepen it.
These findings are highly relevant for analyses of Belgian politics in which parties traditionally play a dominant role (Deschouwer, 2009). Despite the often-heard message of party decline and the waning of party-based cleavages in society, a general pattern of stability emerges from this article. Parties thus still remain important actors in Belgium’s consociational democracy. These findings shed more light on the parties’ role and continued dominance, and given the key role of parties in the Belgian democratic system, they give us more insight into the broader political system. Lessons learnt in this article are also relevant for countries beyond Belgium. Other European countries (the Netherlands and Austria, for instance) have also been labelled as consociational democracies, where parties share similar features and similar roles as those in Belgium. Also, in those countries there are indications of a waning role for parties, and it remains to be seen whether this implies also a decline in their consociational features. Our analysis on Belgian parties could inspire similar studies in these countries too. References Beyens, S., Deschouwer, K., van Haute, E., Verthé, T. (2015). Born again, or born anew: Assessing the newness of the Belgian political party New-Flemish Alliance (N-VA). Party Politics, 23(4), 389-399.
Billiet, J. (1982). Verzuiling en politiek: theoretische beschouwingen over België na 1945. Belgisch Tijdschrift voor Nieuwste Geschiedenis, 13, 85-118.
Bouteca, N., Devos, C., Van de Voorde, N. (2017). Zijn Vlaamse partijen makelaars of ideologen? Een onderzoek op basis van inhoudelijke opvattingen van partijleden. In B. Wauters (Ed.), Wie is nog van de partij? (pp.81-100). Leuven, Belgium: Acco.
Deschouwer, K. (1994). The decline of consociationalism and the reluctant modernization of Belgian mass parties. In R. S. Katz & P. Mair (Eds.), How parties organize. Change and adaptation in party organizations in western democracies (pp.80-108). London: Sage.
Deschouwer, K. (2009). The politics of Belgium. New York, Basingstoke: Palgrave Macmillan.
Deschouwer, K. & Opsomer, M. (1993). Politieke participatie van partijmilitanten. Res Publica, 32(2), 213-219.
Deschouwer, K., Pilet, J.-B., van Haute, E. (2018). Party families in a split party system. In K. Deshouwer (Ed.), Mind the gap. Political participation and representation in Belgium (pp. 91-112). London: Routledge.
Devroe, R., de Vet, B. & Wauters, B. (2017). De partijbasis als microkosmos? De representativiteit van partijleden onderzocht. In B. Wauters (Ed.), Wie is nog van de partij? (pp. 23-42). Leuven, Belgium: Acco.
Devroe, R. & Van de Voorde, N. (2017). Partijactivisme, met lede(n) ogen aanzien. In B. Wauters (Ed.), Wie is nog van de partij? (pp. 43-62). Leuven, Belgium: Acco.
Dewachter, W. (2003). Van oppositie tot elite. Over macht, visie en leiding. Leuven, Belgium: Acco.
Dobbelaere, K. (2017). Religion and politics in Belgium: From an institutionalized manifest catholic to a latent Christian pillar. Politics and Religion Journal, 4(2), 283-296.
Downs, A. (1957). An economic theory on democracy. New York: Harper & Row.
Fukuyama, F. (1992). The end of history and the last man. New York: Free Press.
Hellemans, S. (1990). De strijd om de moderniteit. sociale bewegingen en verzuiling in Europa sinds 1800. Leuven, Belgium: Universitaire Press.
Huyse, L. (1970). Passiviteit, pacificatie en verzuiling in de Belgische politiek. Een sociologische studie. Antwerpen: Standaard Wetenschappelijke Uitgeverij.
Lijphart, A. (1969). Consociational democracy. World Politics, 21(2), 207-225.
Lijphart, A. (2012). Patterns of democracy. Government forms and performance in thirty-six countries (2nd ed.). New Haven and London: Yale University Press.
Lipset, S. & Rokkan, S. (Eds.) (1967). Party systems and voter alignments: Cross-national perspectives. New York: Free Press.
Lorwin, V. (1966). Belgium: Religion, class and language in national politics. In R. Dahl (Ed.), Political oppositions in western democracies (pp.147-187). New Haven, CT: Yale University Press.
Luther, K.R. (1999). A Framework for the comparative analysis of political parties and party systems in consociational democracy. In K.R. Luther & K. Deschouwer (Eds.), Party elites in divided societies (pp. 3-19). London: Routledge.
Marien, S. & Quintelier, E. (2011). Trends in party membership in Europe. Investigation into the reasons for declining party membership. In E. van Haute (Ed.), Party membership in Europe: Exploration into the anthills of party politics (pp. 43-58). Brussels, Belgium: Editions de l’Université de Bruxelles.
Meguid, B.M. (2005). Competition between unequals: The role of mainstream party strategy in niche party success. American Political Science Review, 99(3), 347-359.
Méndez-Lago, M. (2004). Electoral consequences of (de-) pillarization. In K. Luther & K. Deschouwer (Eds.), Party elites in divided societies: Political parties in consociational democracy (pp. 191-224). London: Routledge.
Pilet, J.-B. (2005). The adaptation of the electoral system to the ethno-linguistic evolution of Belgian consociationalism. Ethnopolitics, 4(4), 397-411.
Pilet, J.-B. & Wauters, B. (2014). The selection of party leaders in Belgium. In J.-B. Pilet & W. Cross (Eds.), The selection of political party leaders in contemporary parliamentary democracies. A comparative study (pp. 30-46). London: Routledge.
Rokkan, S. (1977). Towards a generalized concept of ‘verzuiling’. A preliminary note. Political Studies, 25(4), 563-570.
Scarrow, S. (2000). Parties without members? In R. Dalton & M. Wattenberg (Eds.), Parties without partisans. Political change in advanced industrial democracies (pp. 79-101). Oxford: Oxford University Press.
van Biezen, I., Mair, P. & Poguntke, T. (2012). Going, going, … gone? The decline of party membership in contemporary Europe. European Journal of Political Research, 51(1), 24-56.
van Haute, E. (2015). Party membership in Belgium. from the cradle to the grave? In E. van Haute & A. Gauja (Eds.), Party members and activists (pp. 34-49). London: Routledge.
van Haute, E., Amjahad, A., Borriello, A., Close, C. & Sandri, G. (2013). Party members in a pillarised partitocracy. An empirical overview of party membership figures and profiles in Belgium. Acta Politica, 48(1), 68-91.
van Haute, E. & Paulis, E. (2017). MAPP dataset. Retrieved from https://zenodo.org/record/61234#.XITlAVQzbIU .
Wauters, B. (2014). Democratising party leadership selection in Belgium: motivations and decision-makers. Political Studies, 61(1), 61-80.
Wauters, B. (Ed.) (2017). Wie is nog van de partij? Crisis en toekomst van partijleden in Vlaanderen. Leuven, Belgium: Acco.
Weldon, S. (2006). Downsize my polity? The impact of size on party membership and members activism. Party Politics, 12(4), 467-481.
Appendix 1. Overview of surveys of party members in Belgium -
1 Owing to the very low response rate of OpenVLD in this survey, we leave them out of the analysis here.
| Party acronym | Year of survey | Mode | Population | Sample size | Valid responses | Valid/sample (%) | Valid/population (%) |
|---|---|---|---|---|---|---|---|
| PS | November 2003 | M | 82,399 | 2,500 | 822 | 32.9 | 1.0 |
| Ecolo | March 2004 | M | 3,208 | 3,200 | 1,029 | 32.2 | 32.0 |
| VLD | January 2006 | M | 72,475 | 2,500 | 465 | 18.6 | 0.6 |
| CD&V | June 2006 | M | 83,180 | 2,500 | 604 | 24.2 | 0.7 |
| OpenVLD | May 2012 | M + I | 66,232 | 1500 | 433 | 28.9 | 0.6 |
| N-VA | April 2012 | M + I | 36,439 | 1500 | 983 | 65.5 | 2.7 |
| CD&V | April 2013 | M + I | 66,031 | 1500 | 666 | 44.4 | |
| Groen | May 2013 | M + I | 7,855 | 1500 | 931 | 62.1 | |
| Sp.a | June 2015 | M + I | 1500 | 583 | 38.9 | ||
| Ecolo | September 2016 | I | 5,856 | / | 627 | 10.7 | |
| CD&V | April 2018 | I | / | 2,623 | |||
| Groen | June 2018 | I | / | 1,205 | |||
| N-VA | December 2017 | I | / | 4,260 | |||
| Sp.a | November 2017 | I | / | 2,684 |